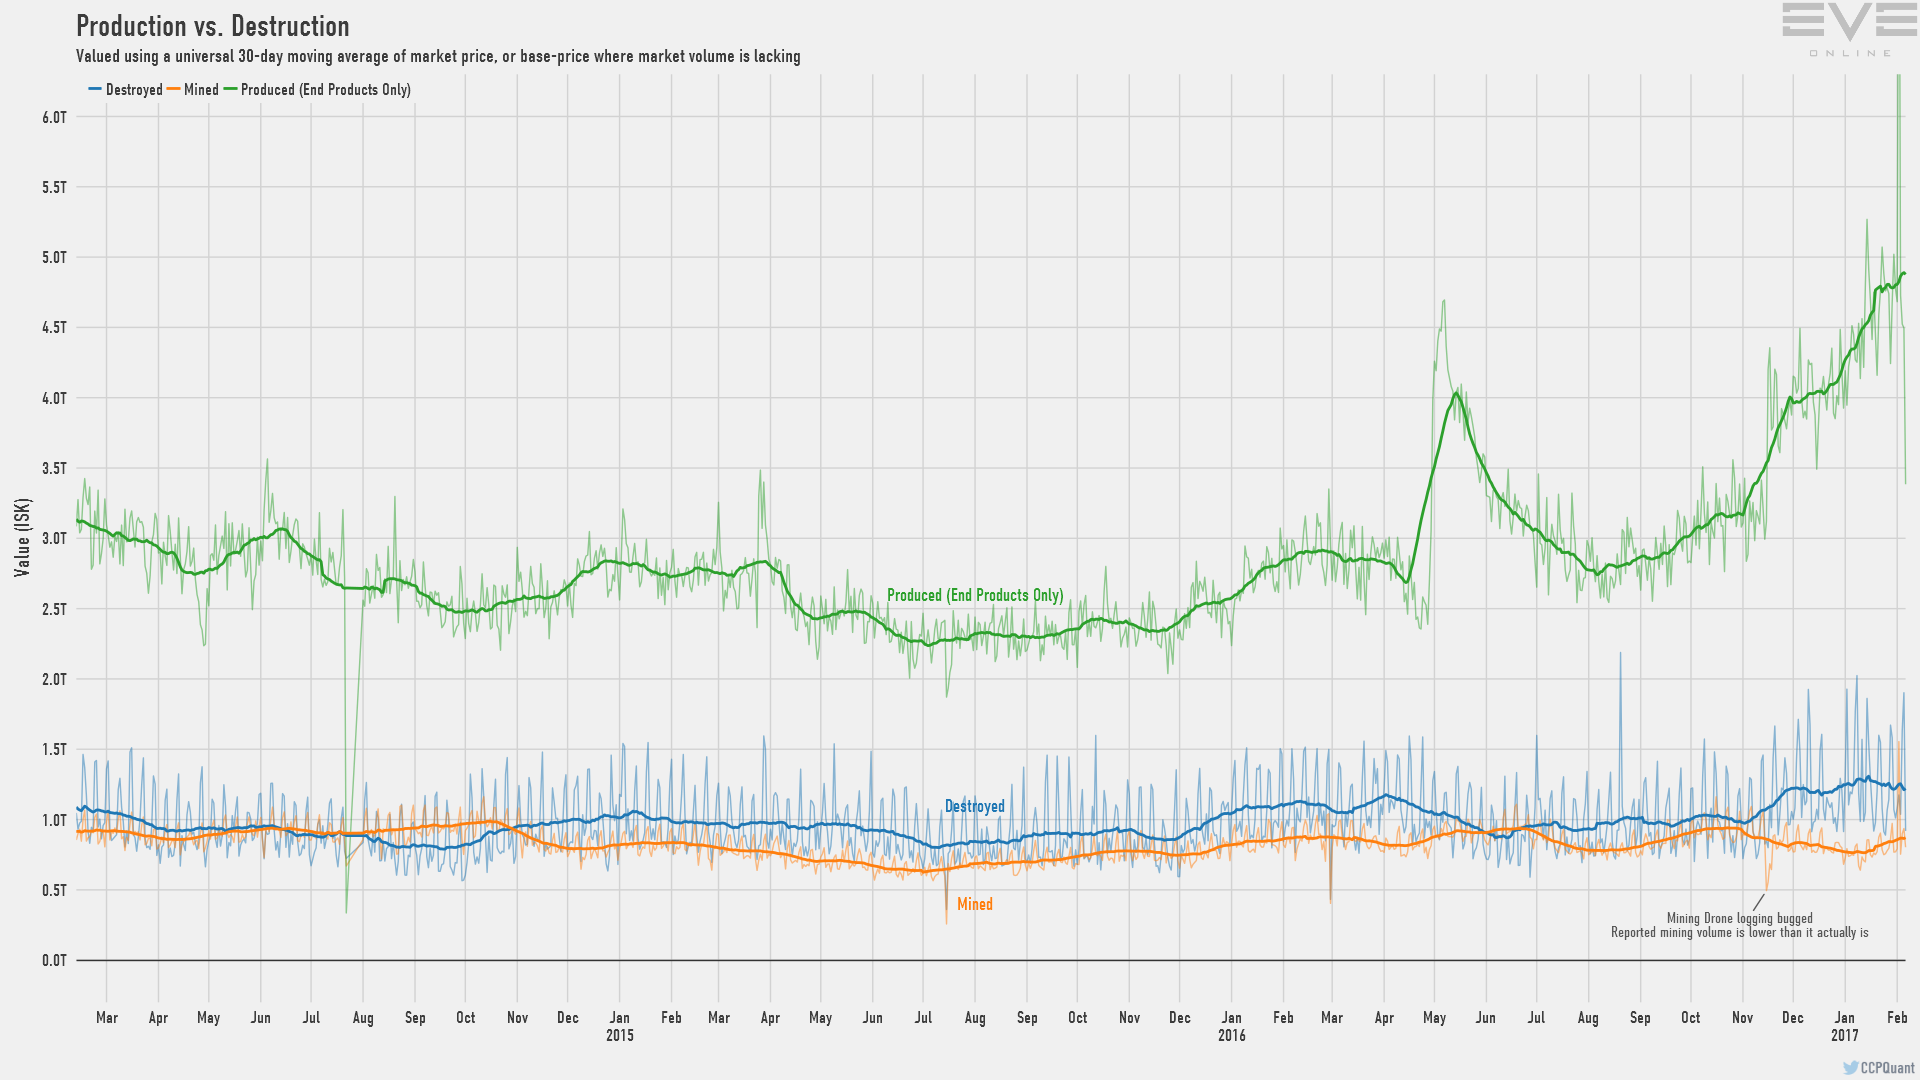
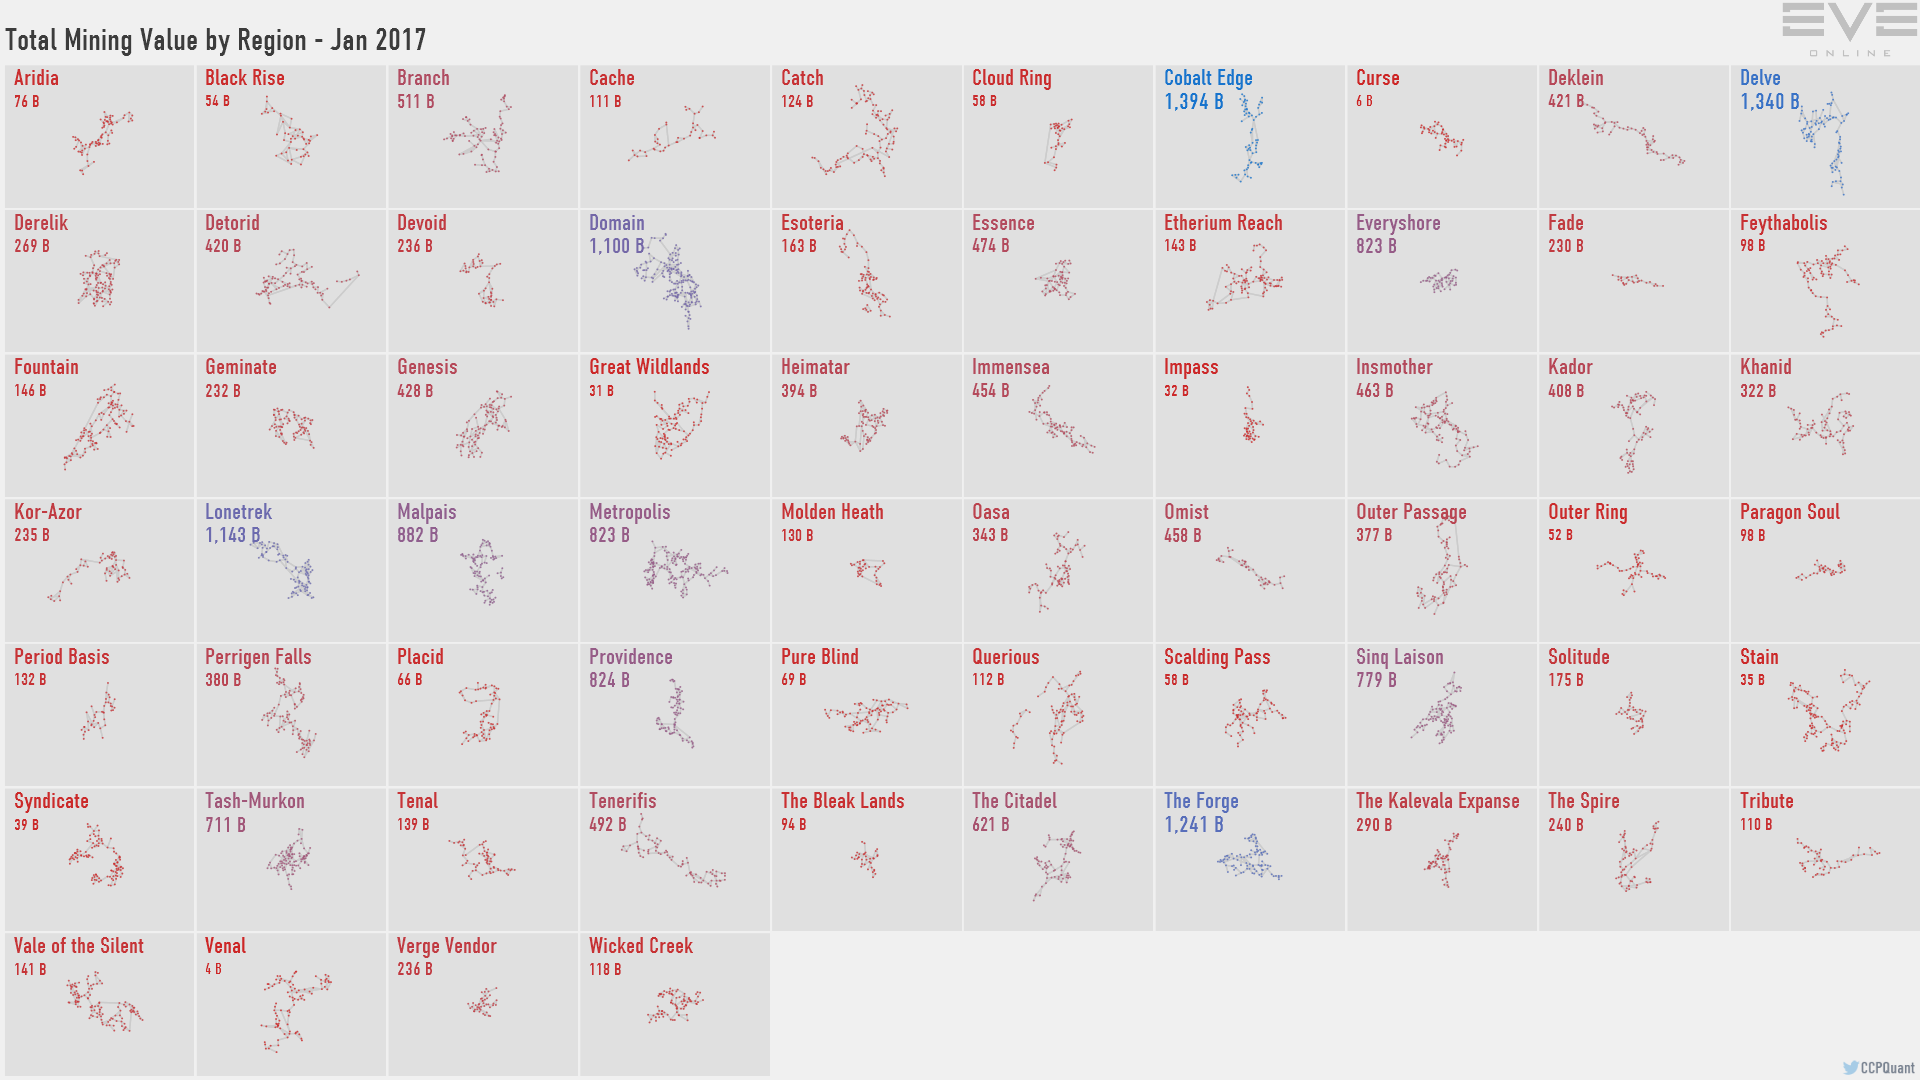
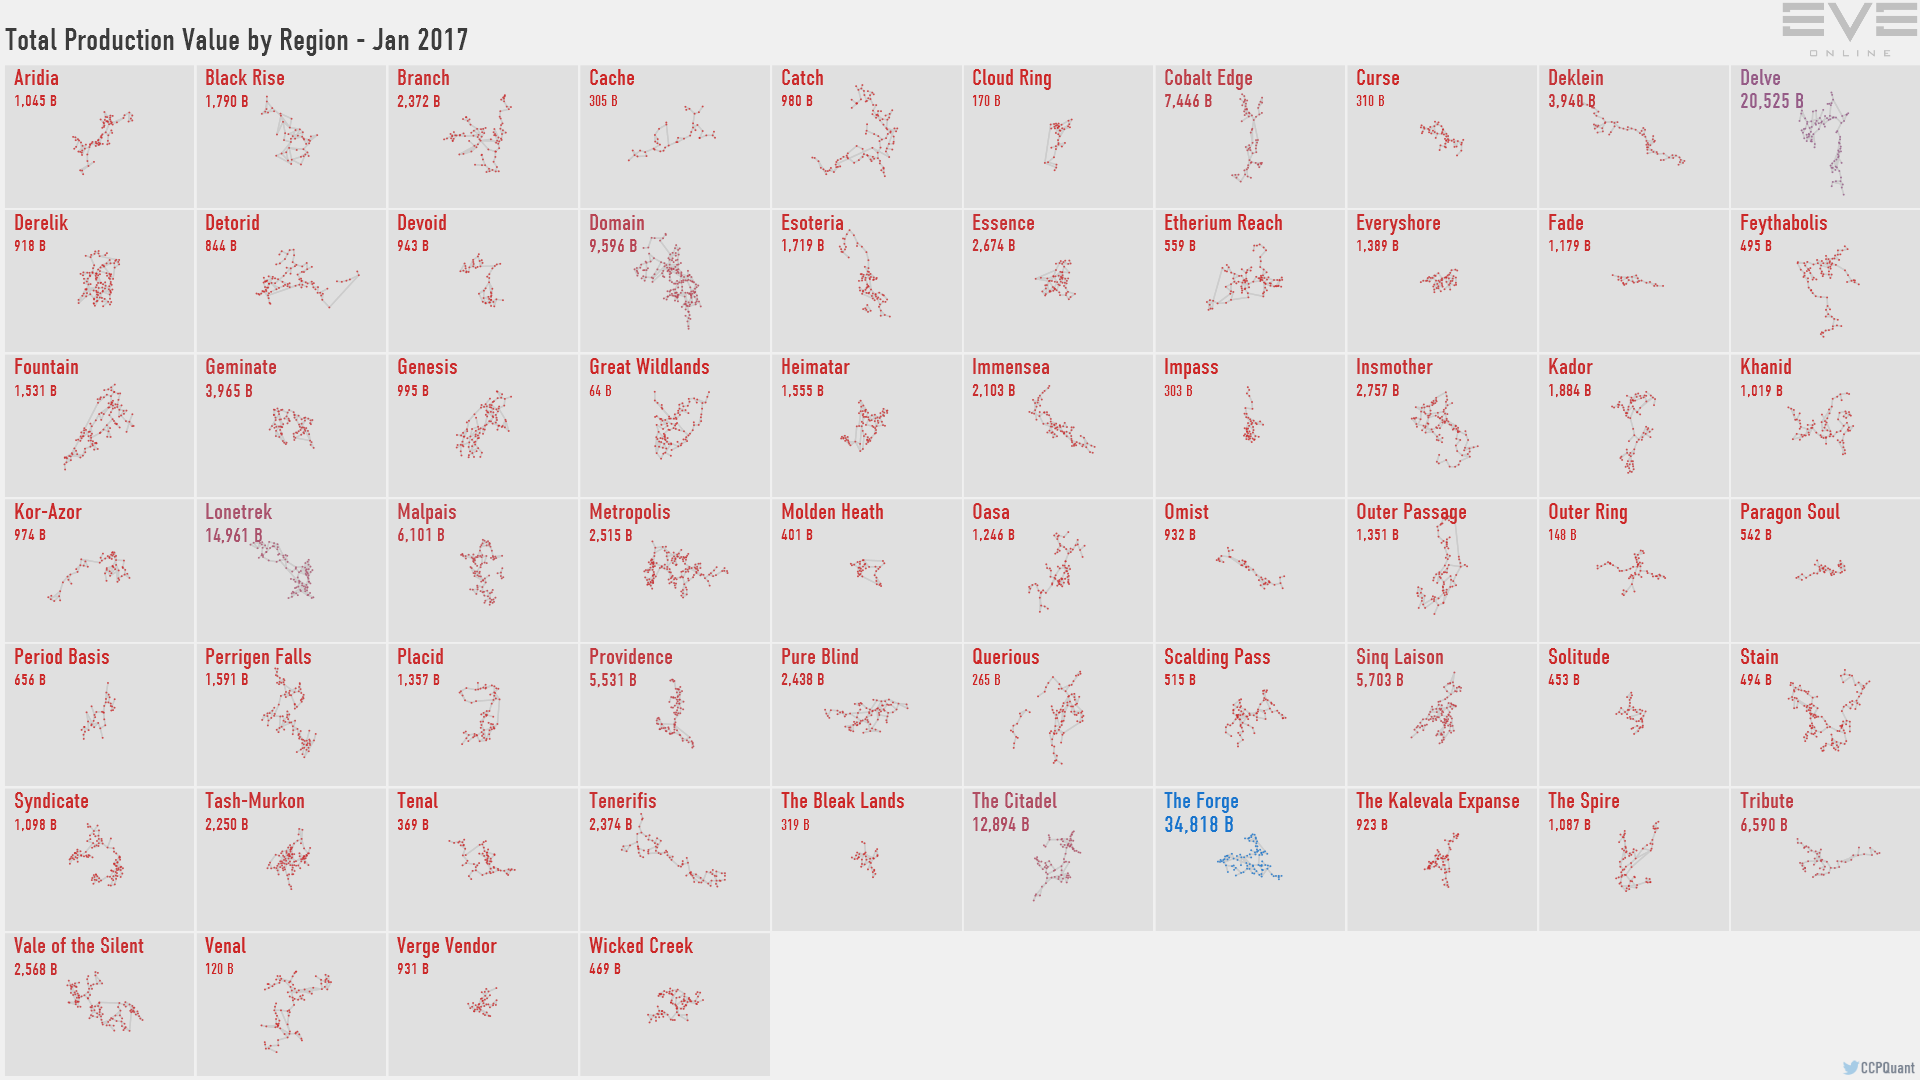
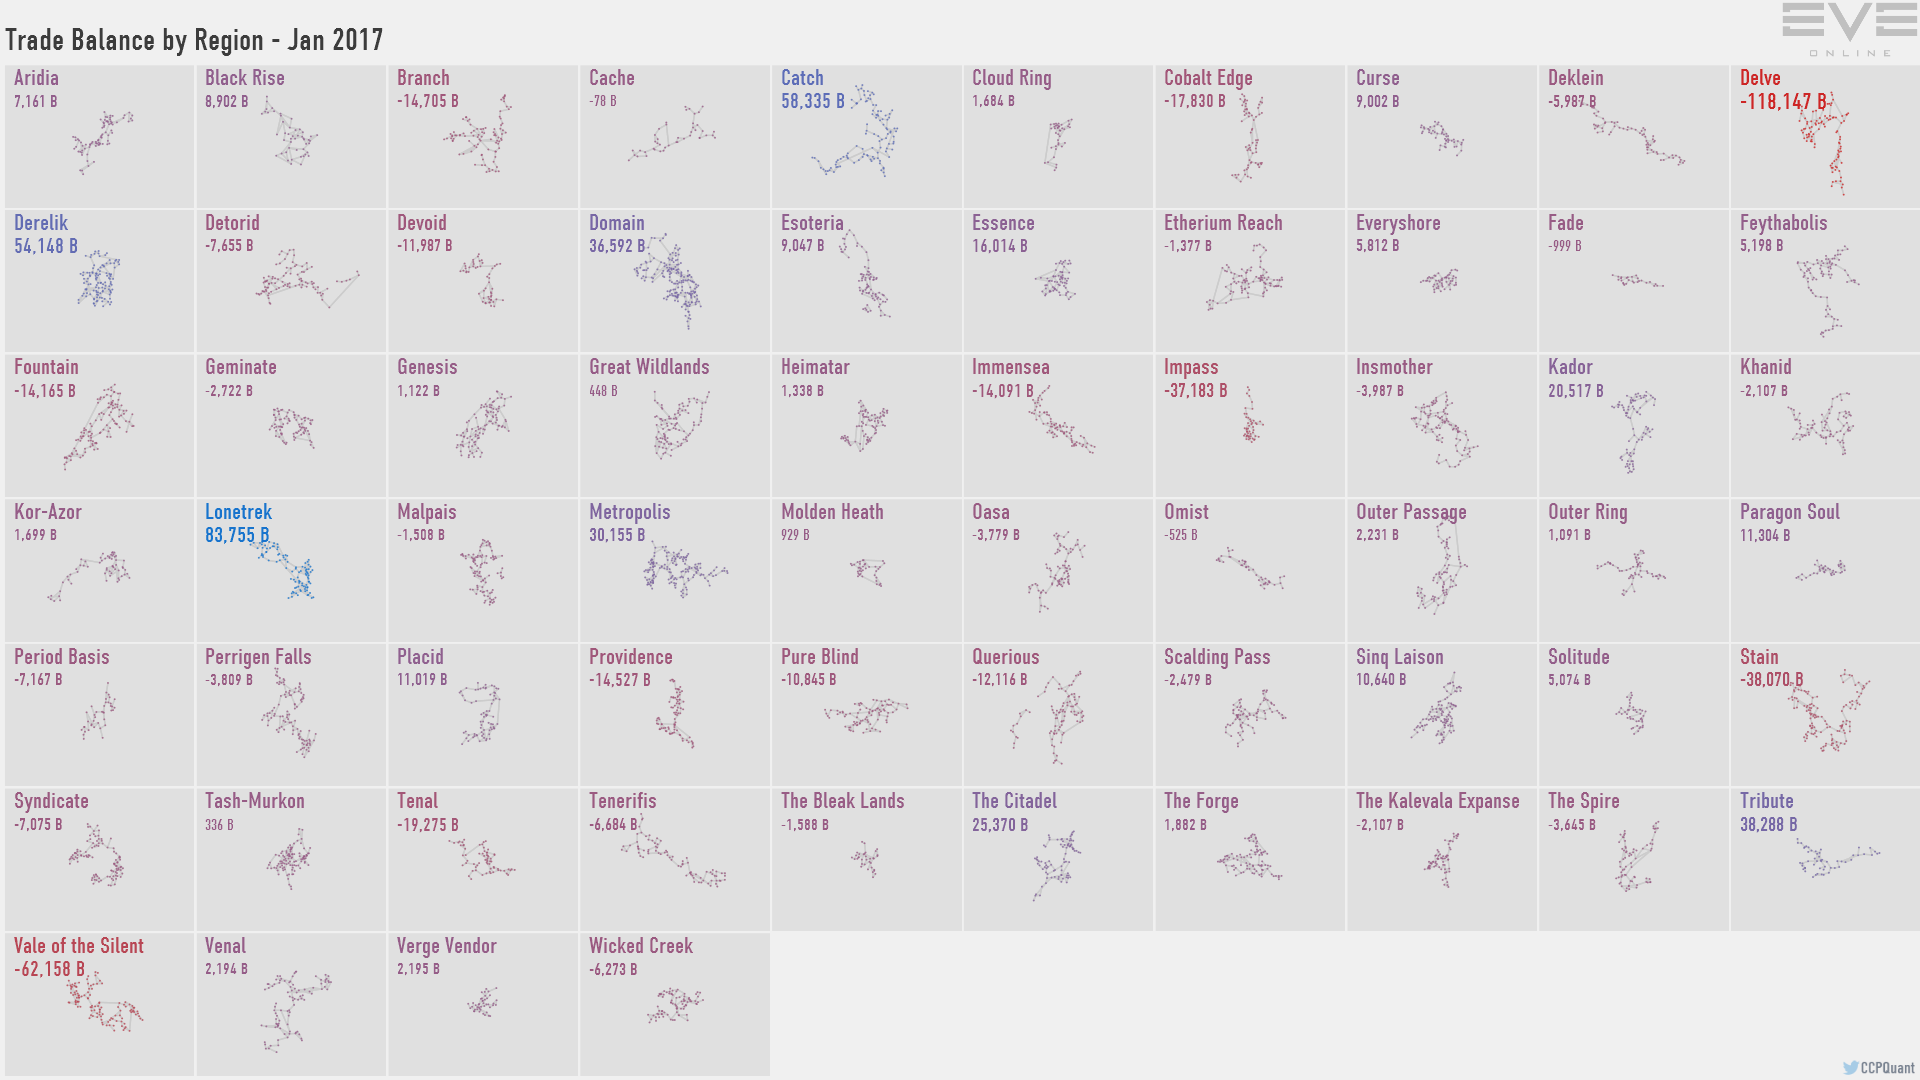
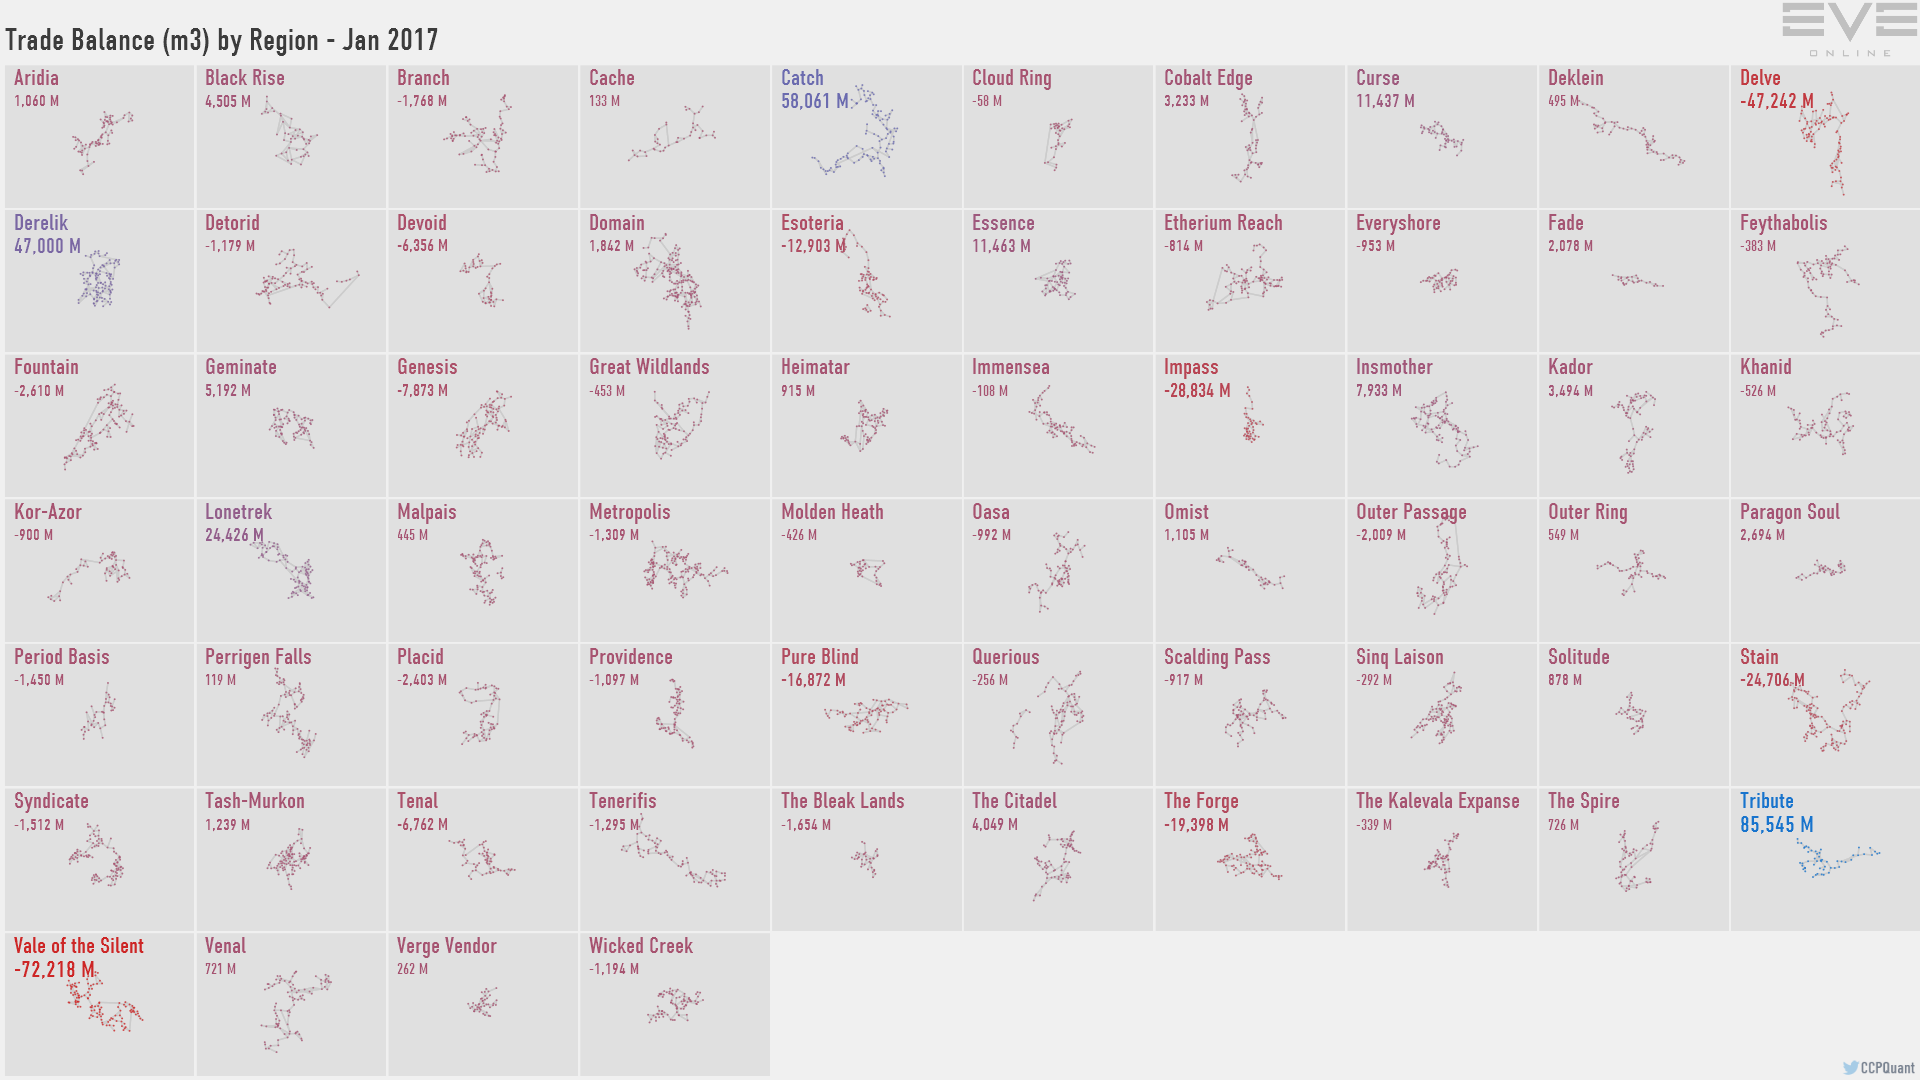
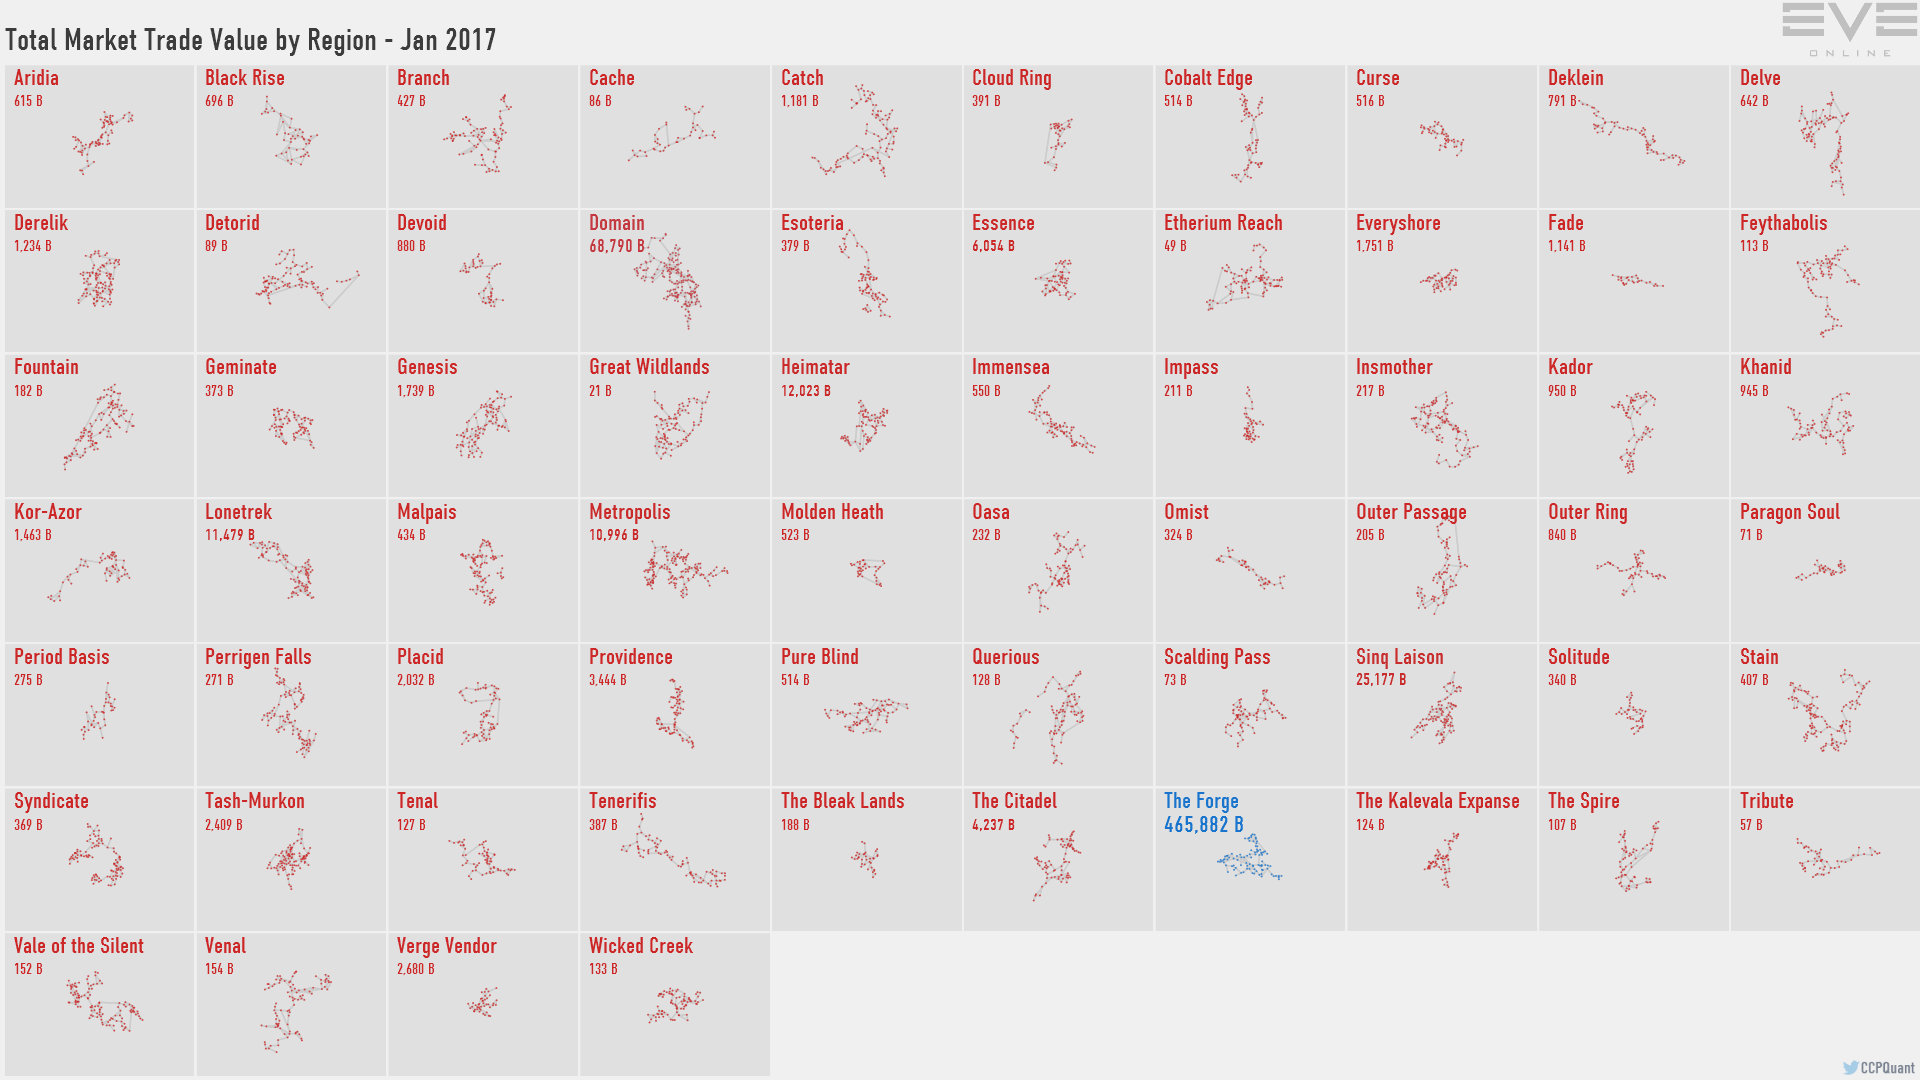
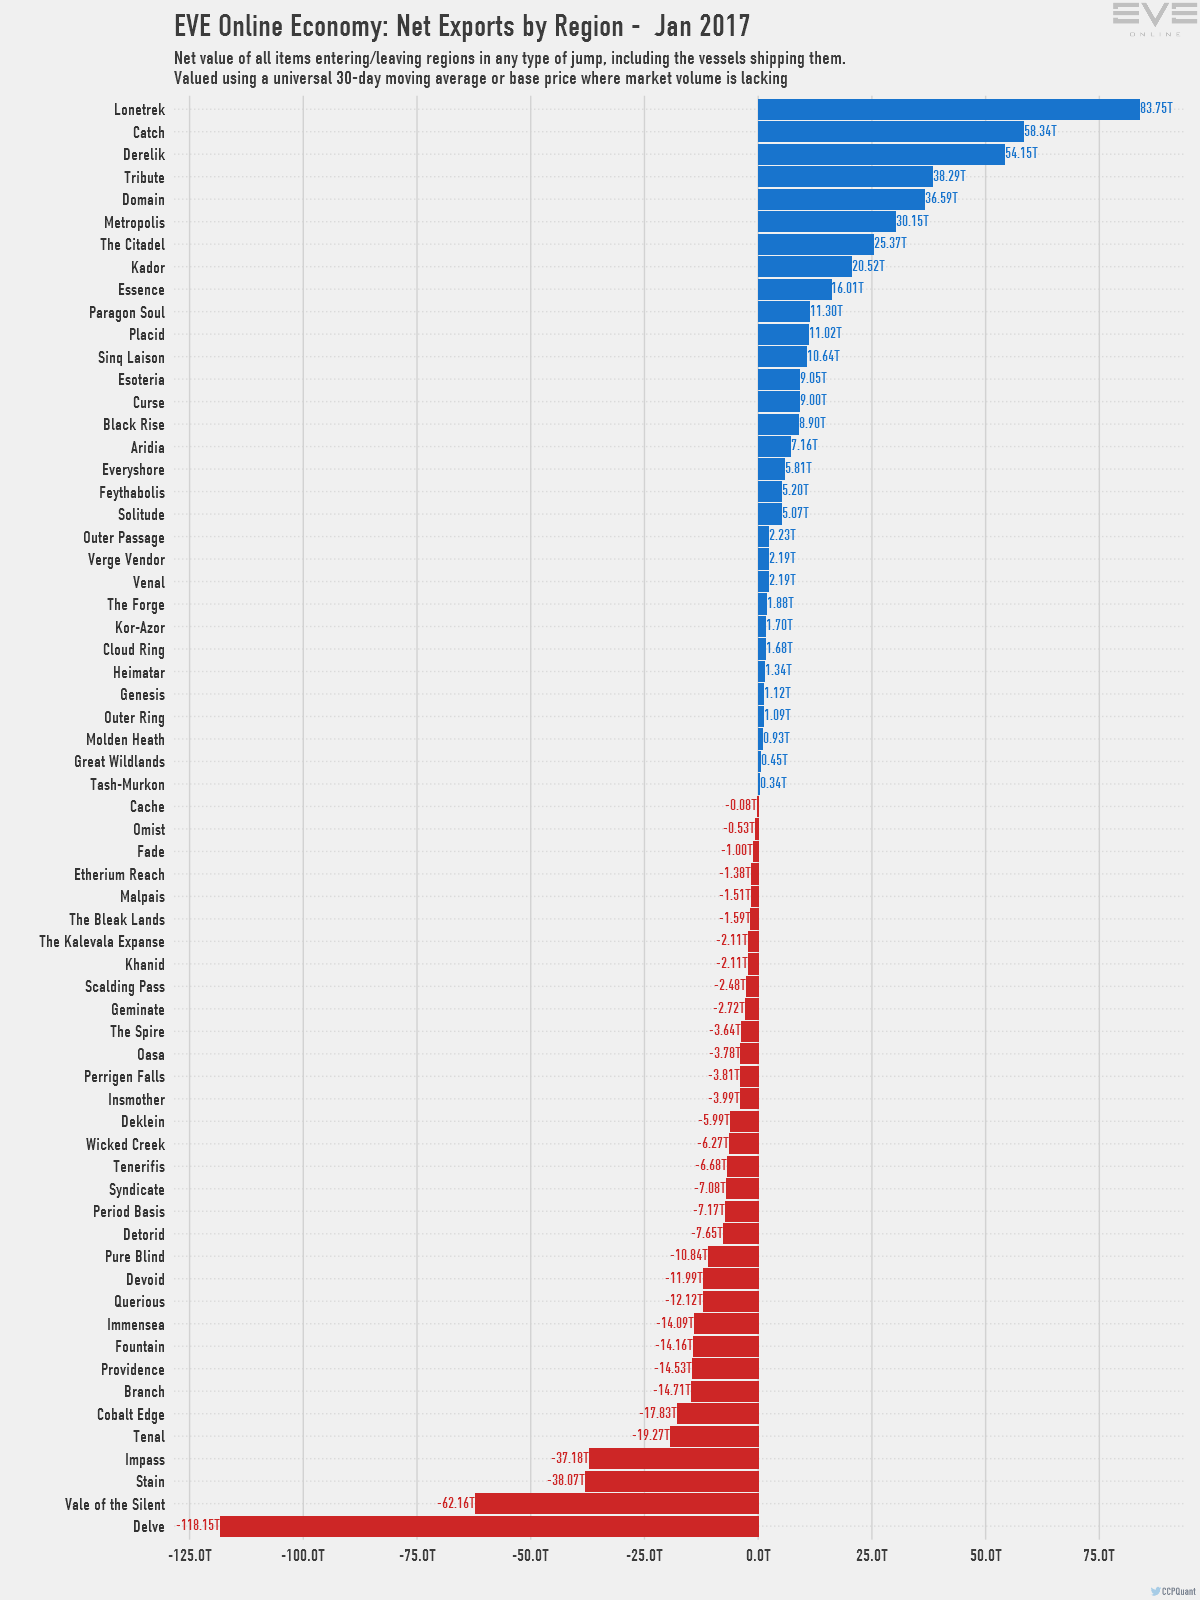
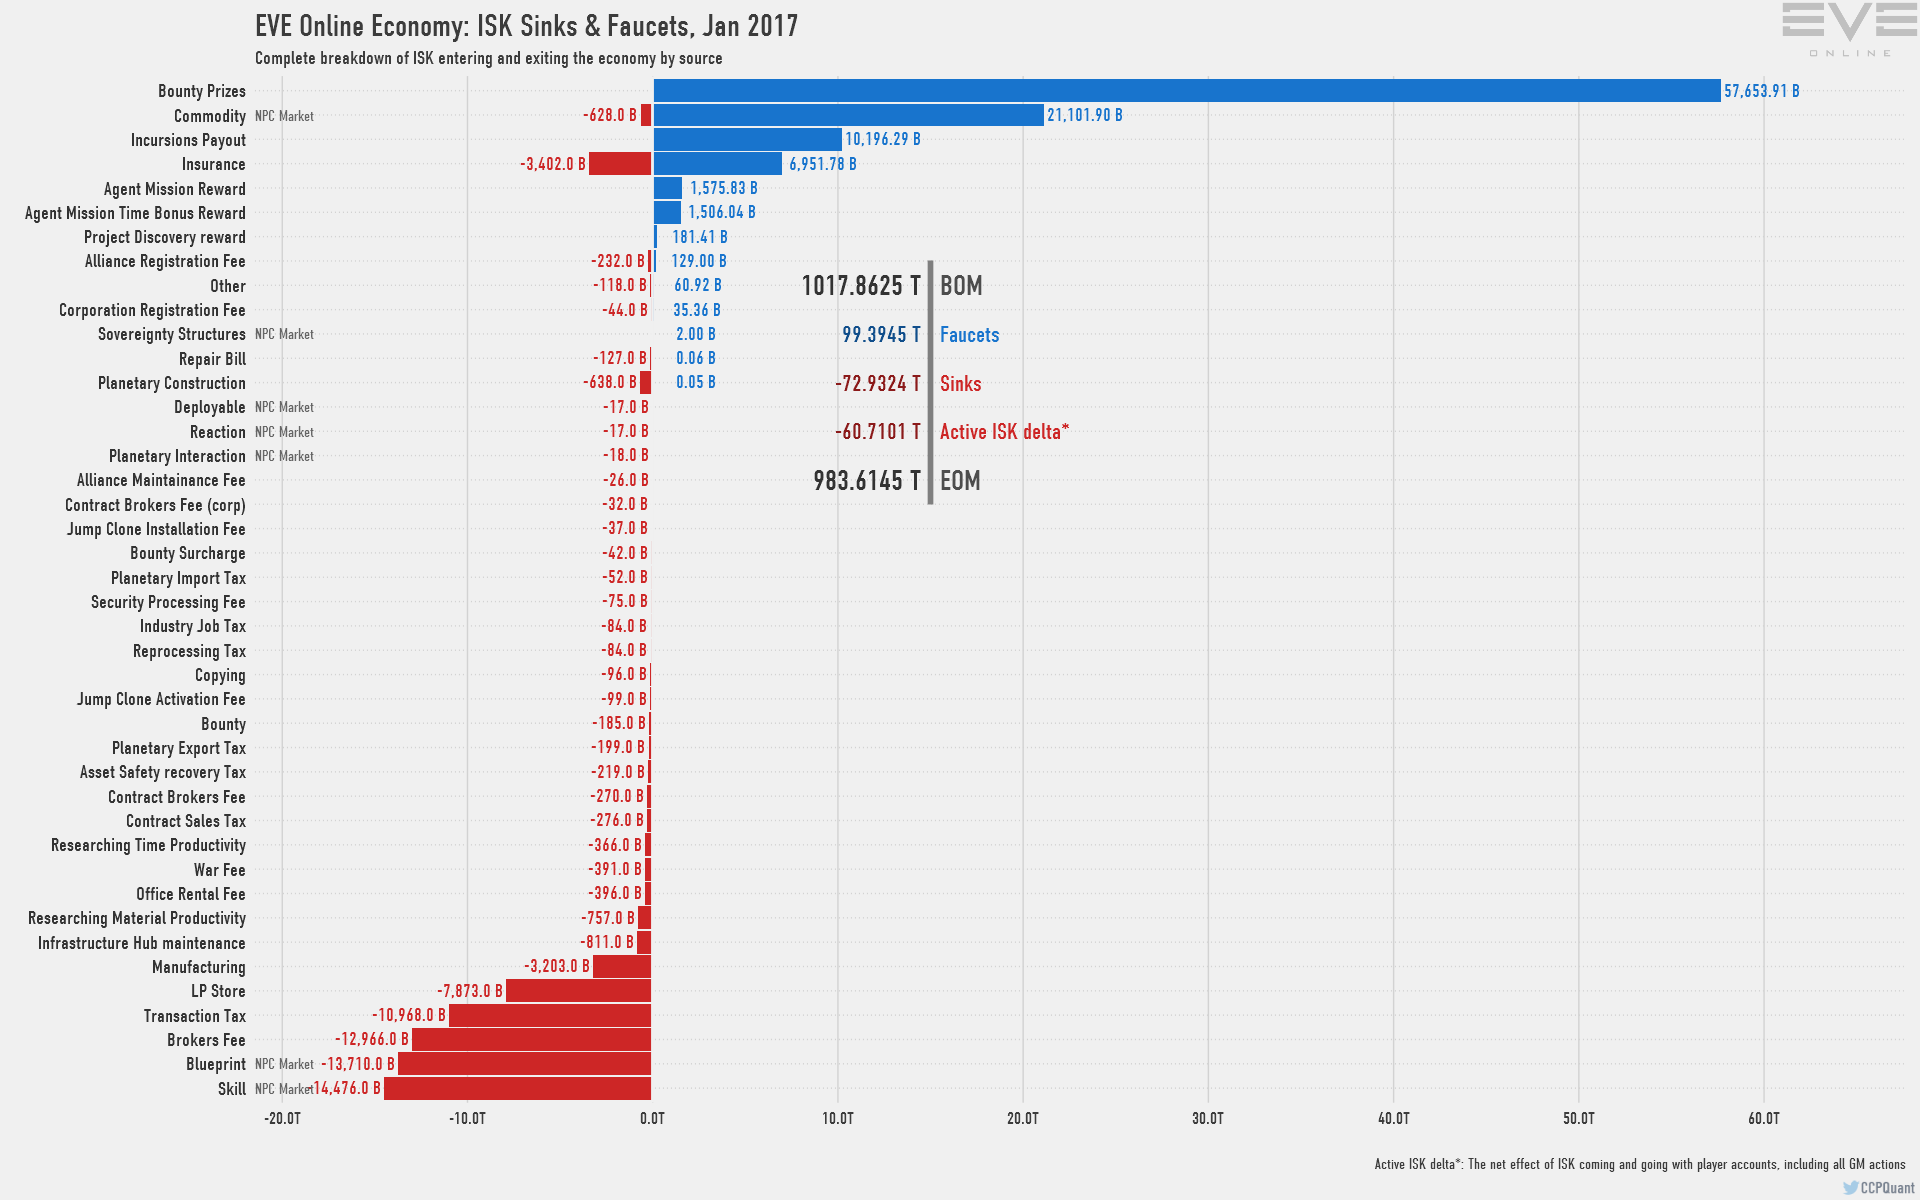
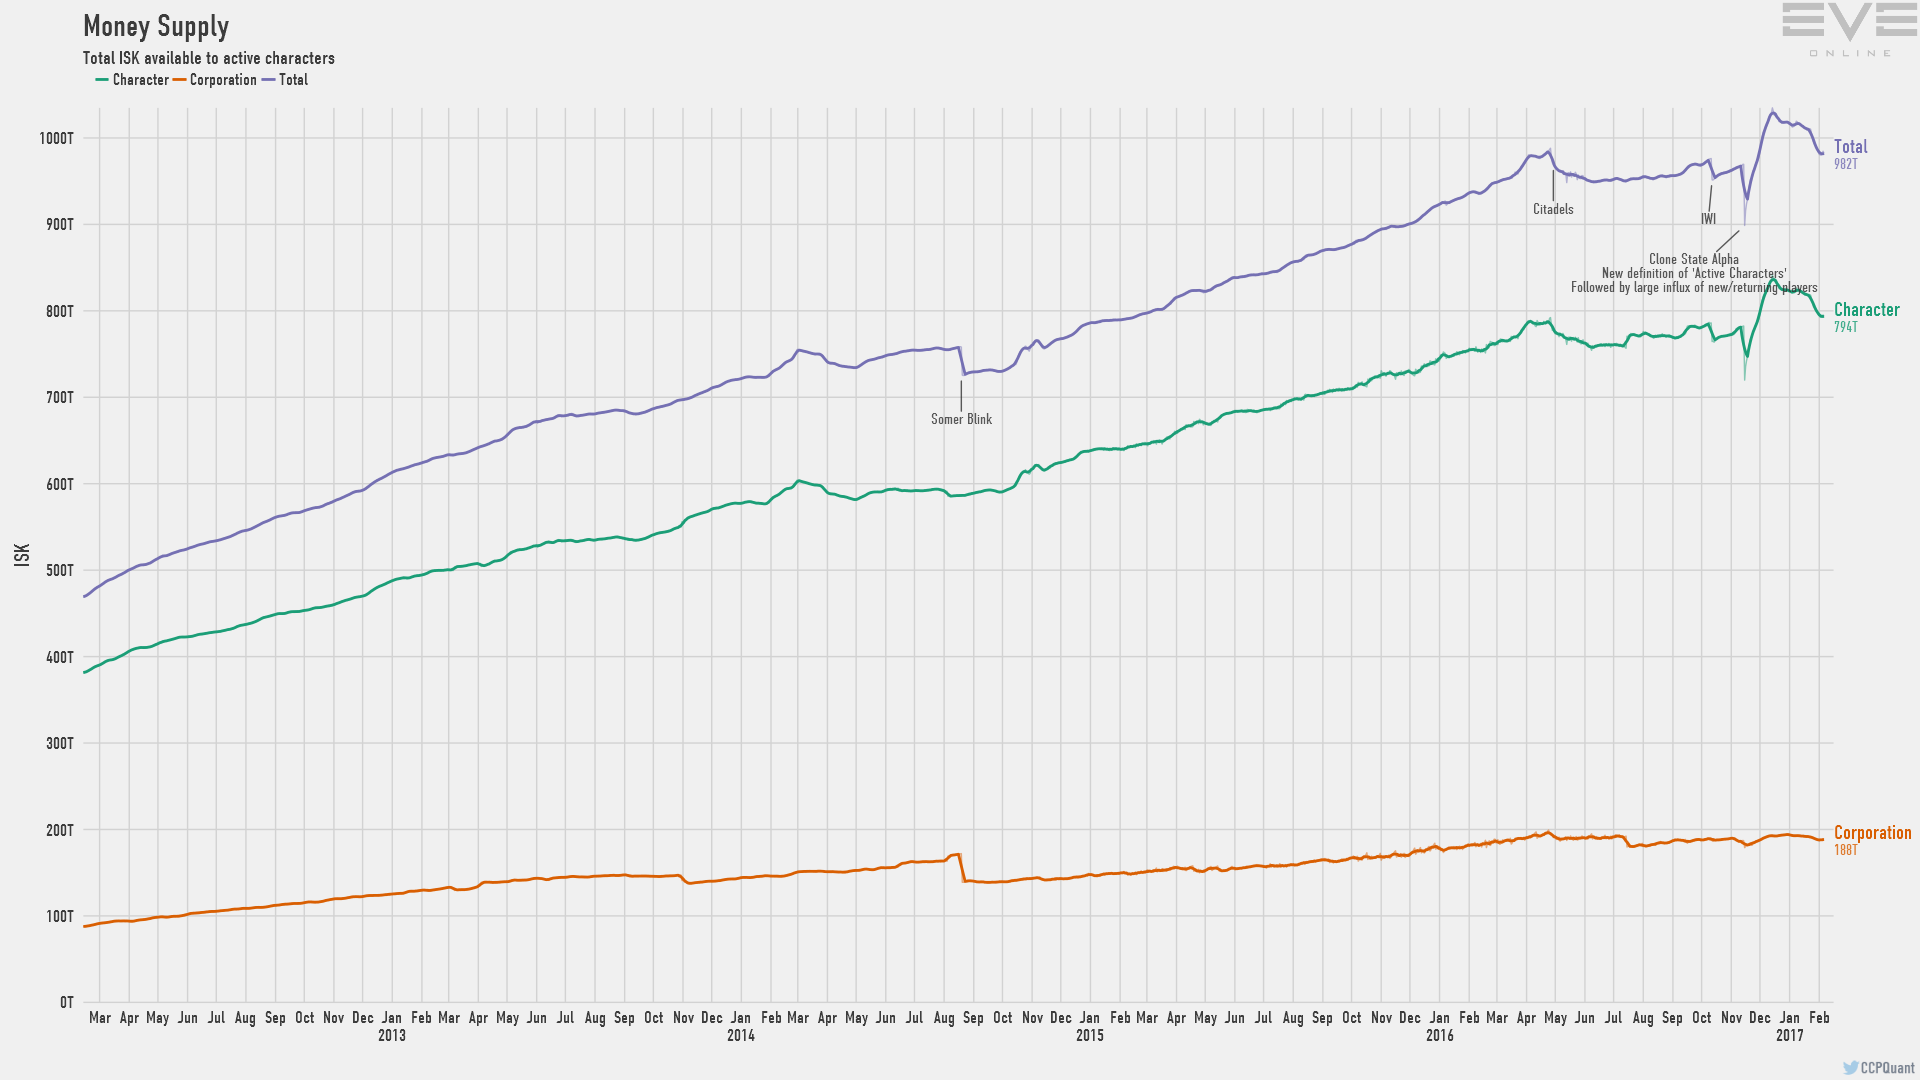
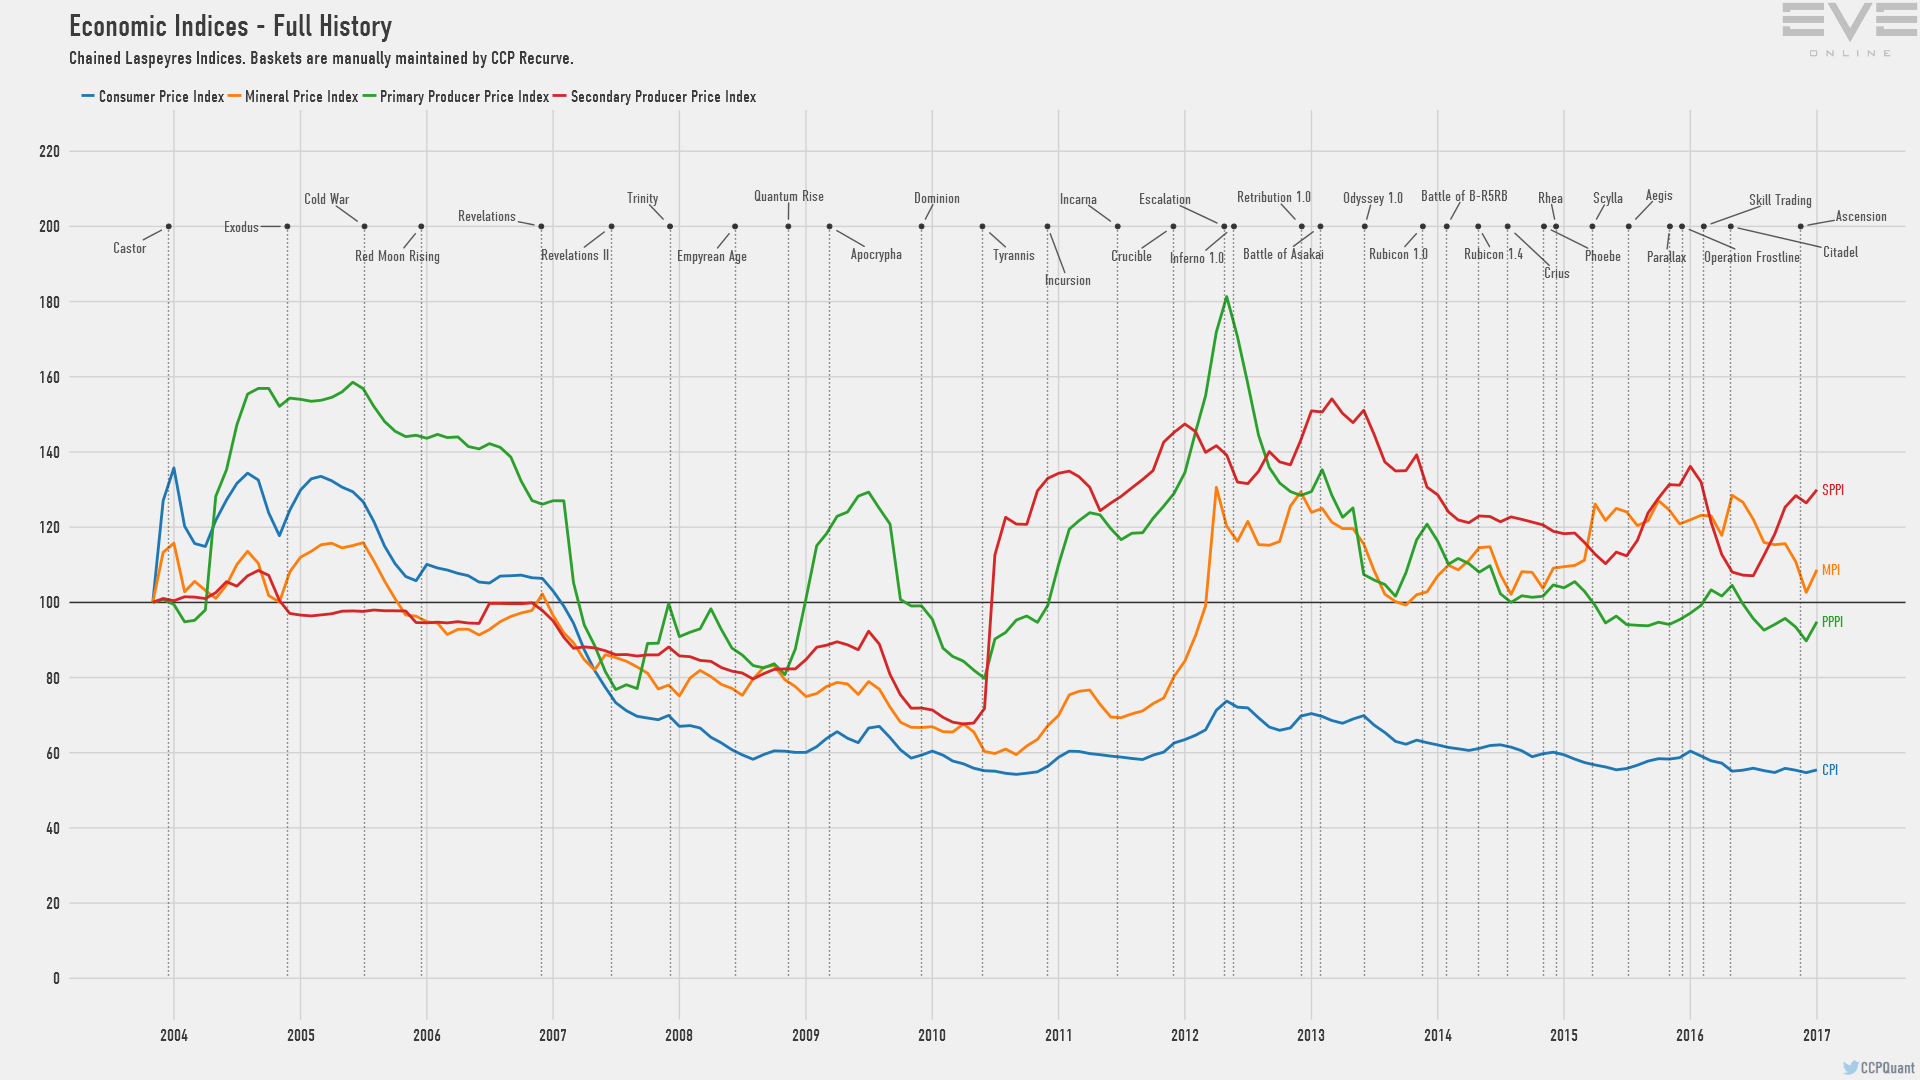
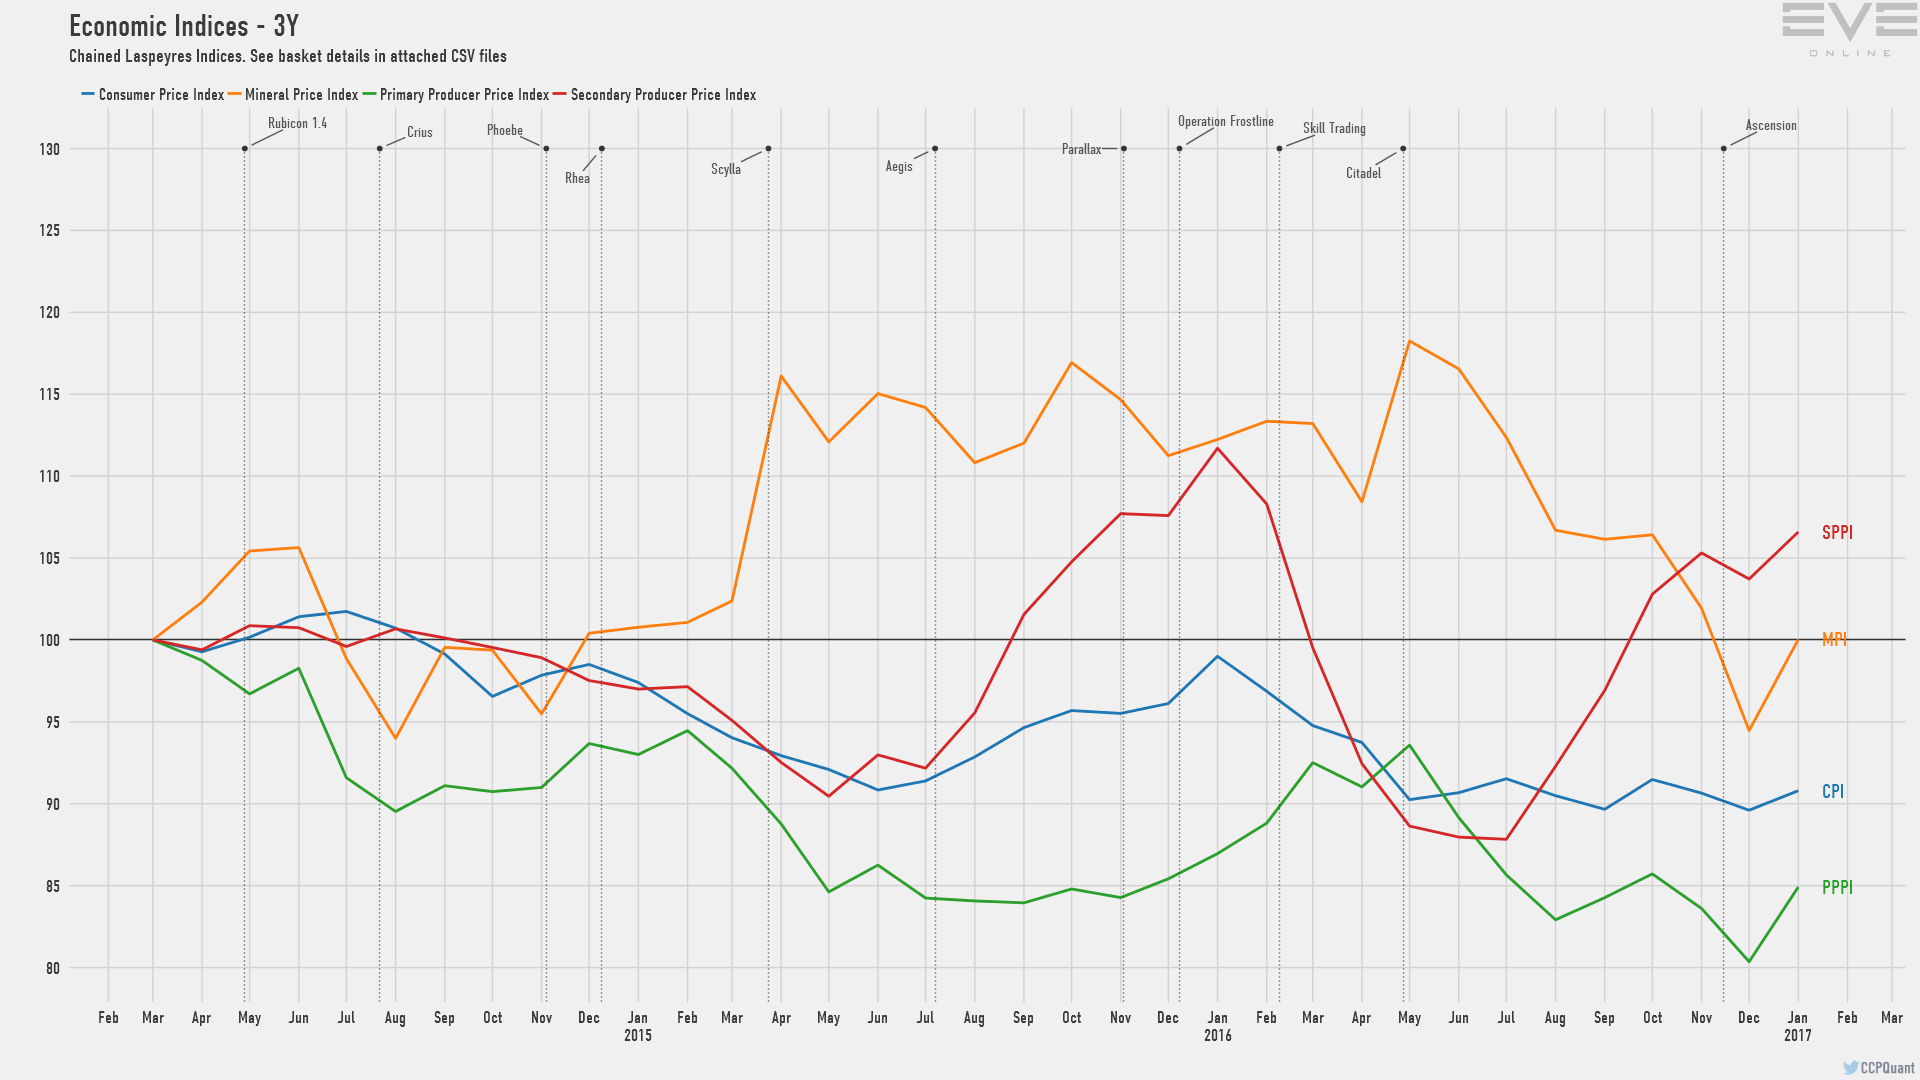
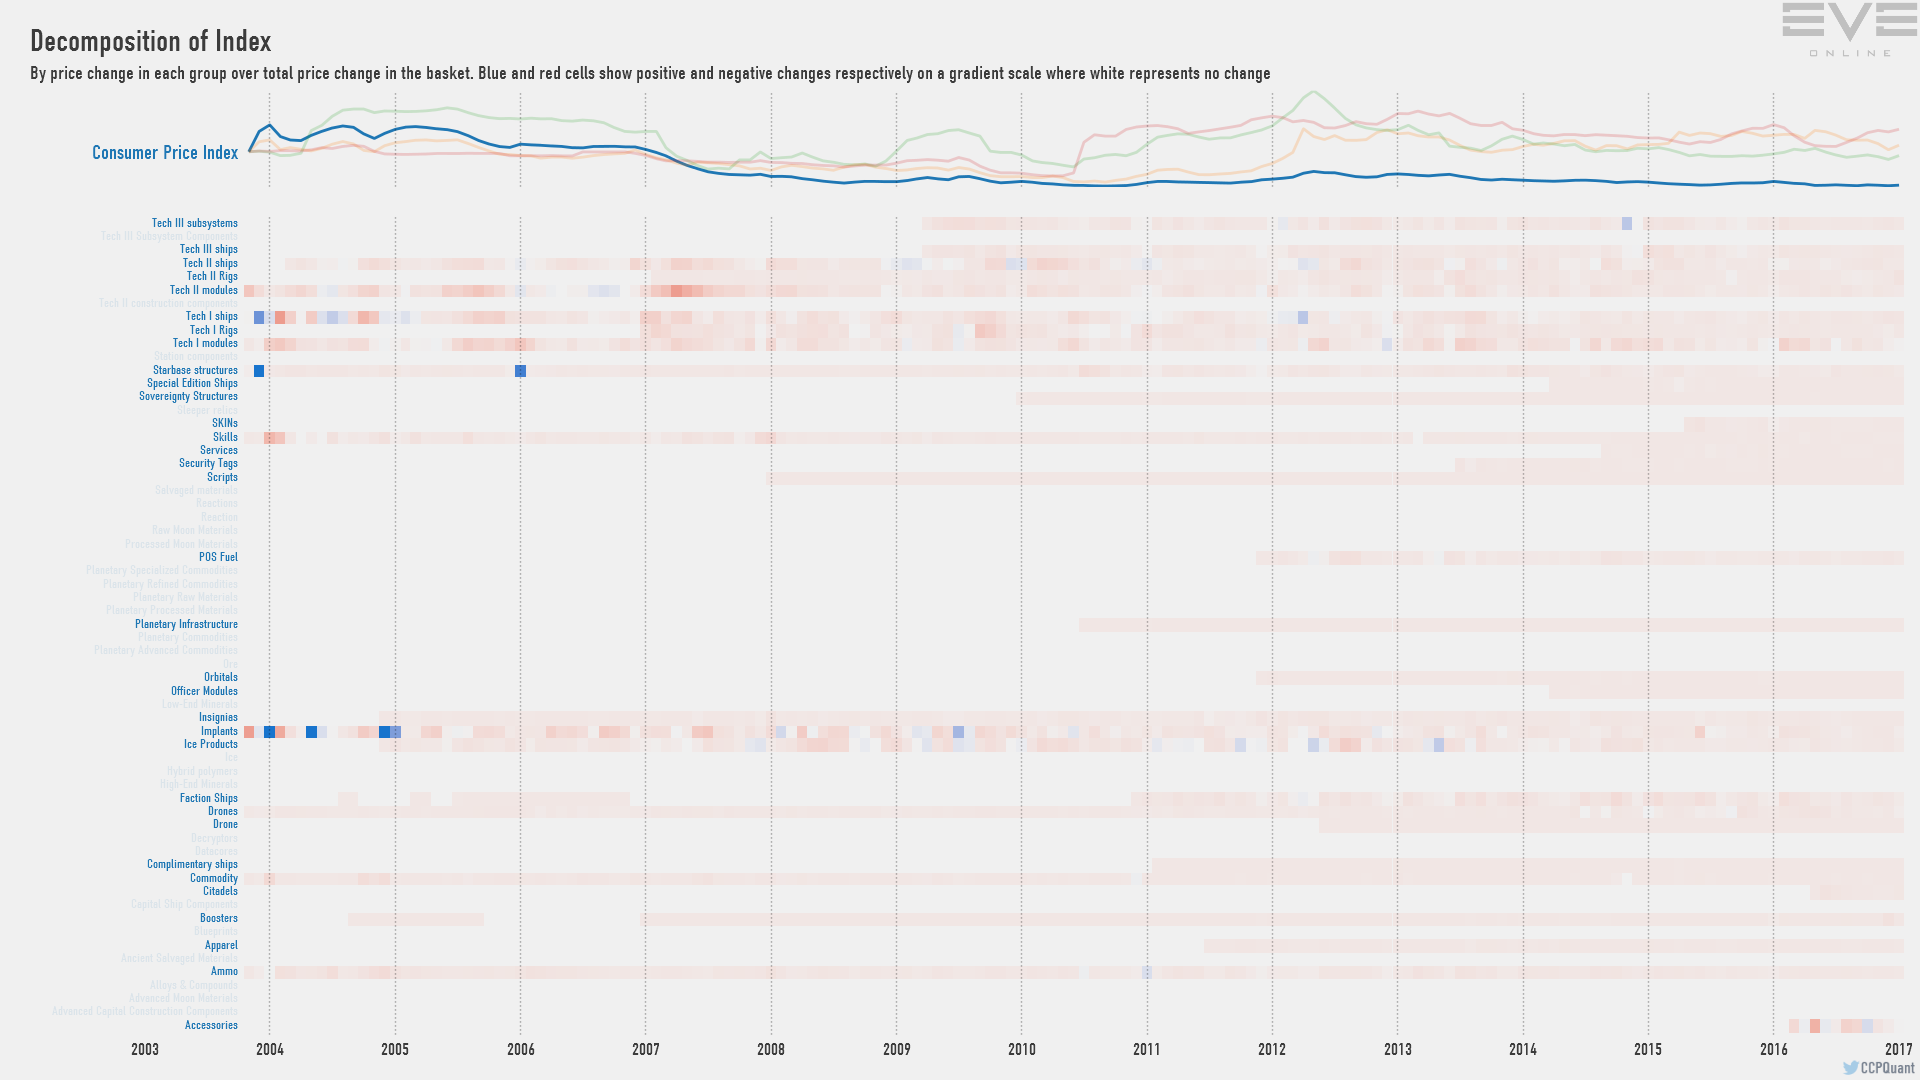
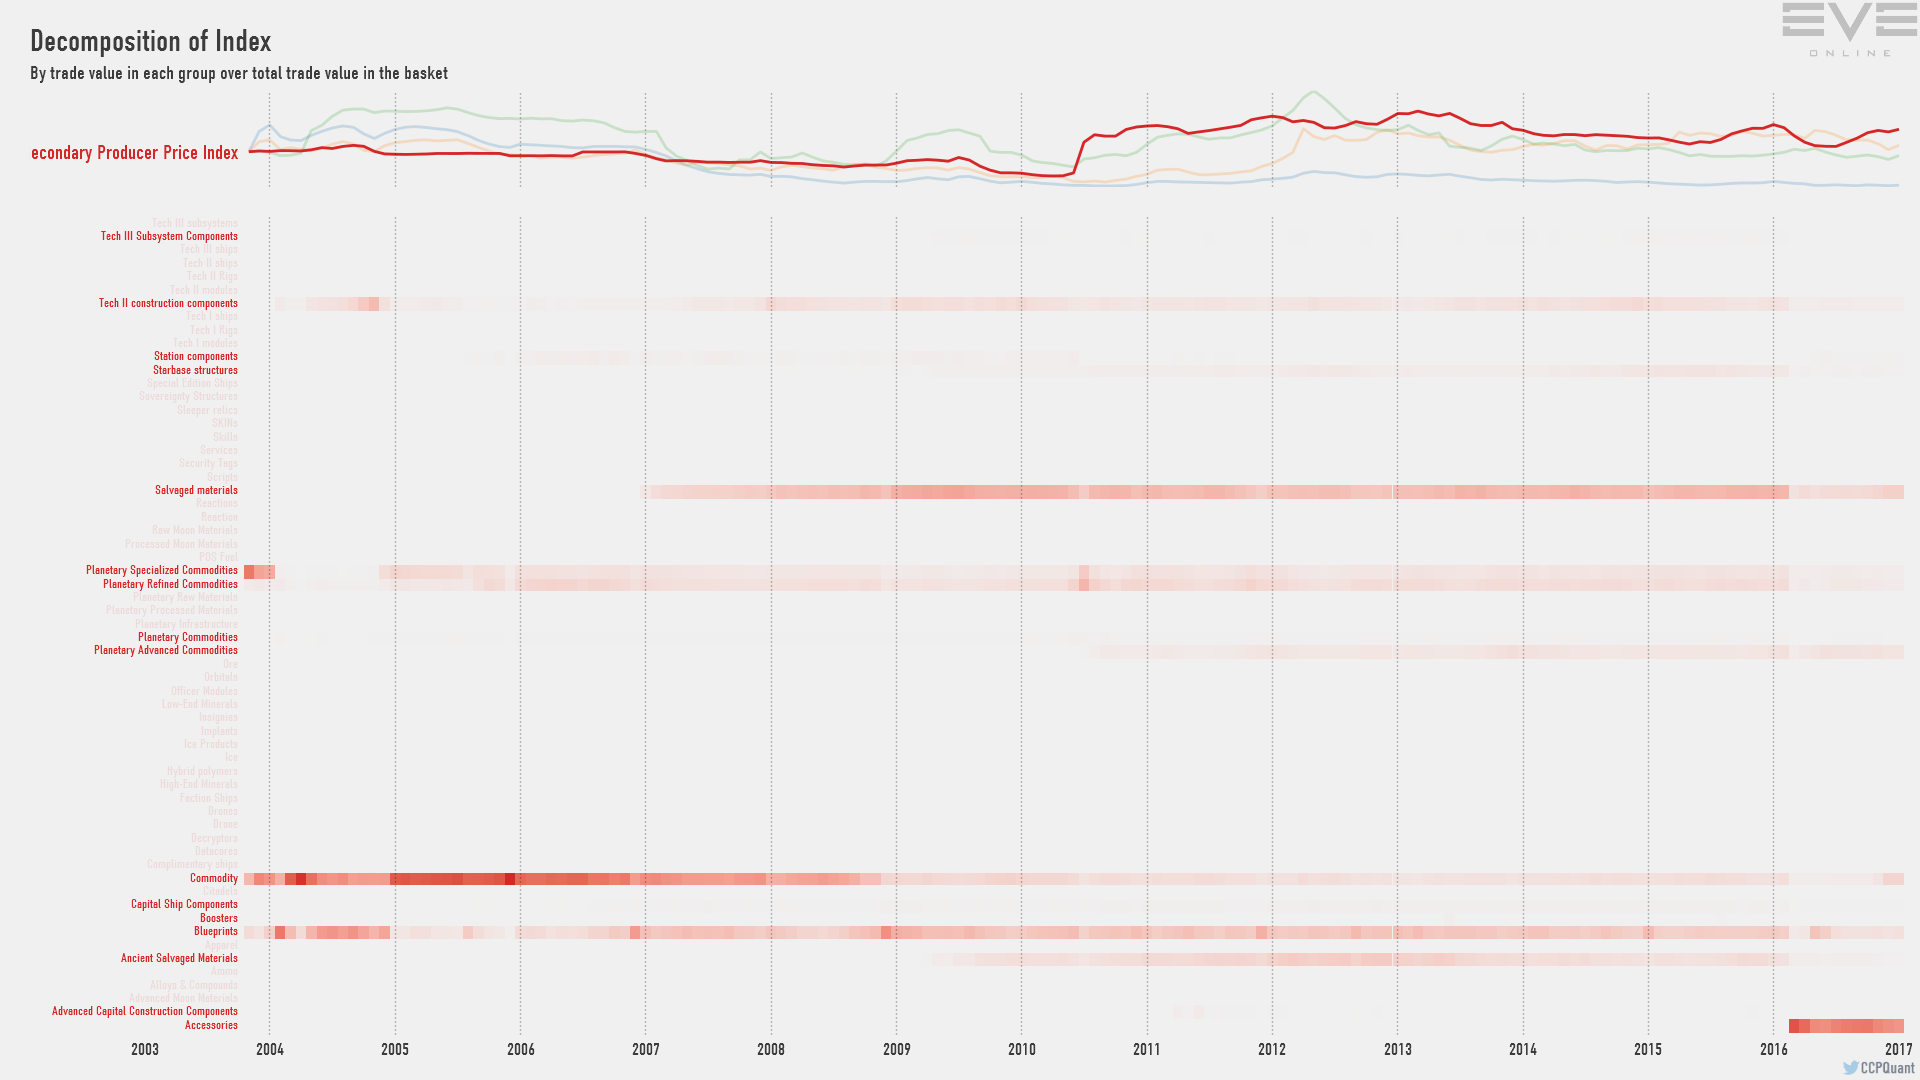
This is the Monthly Economic Report (MER) for January 2017.
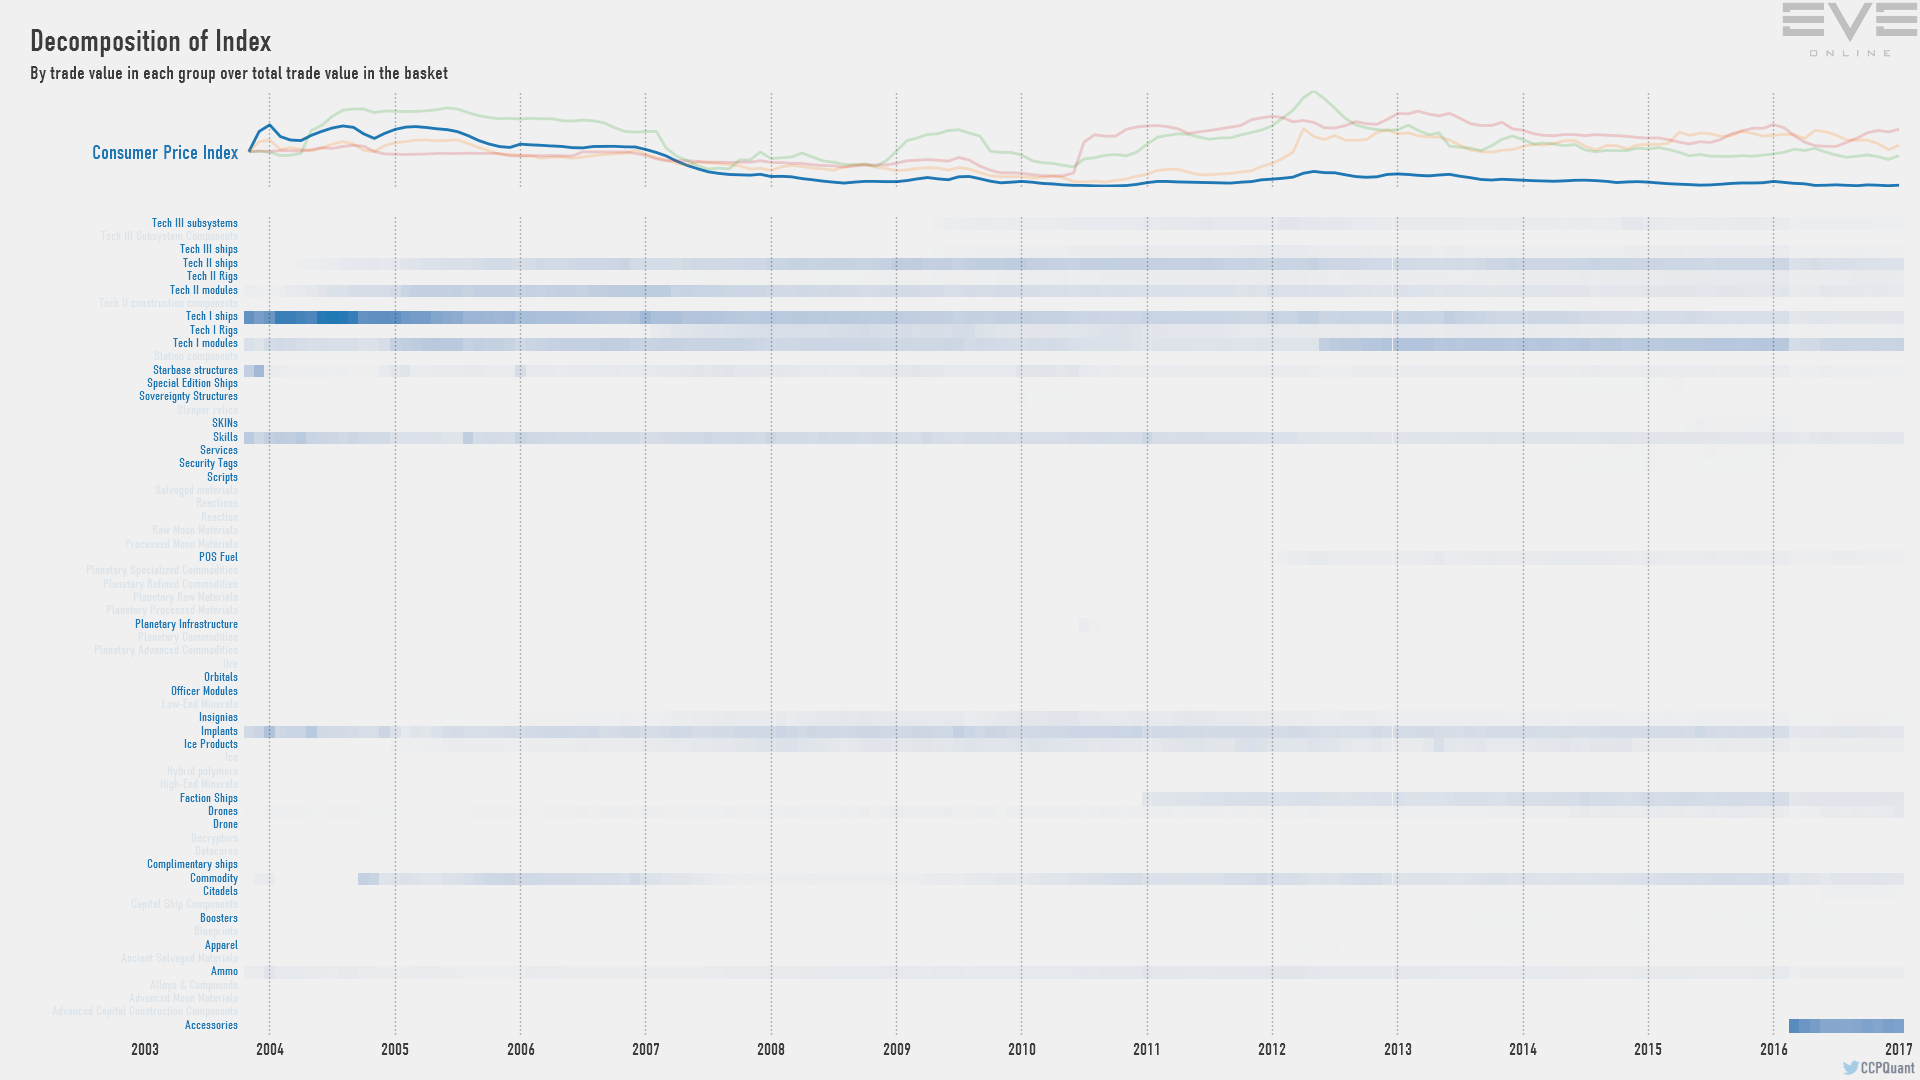
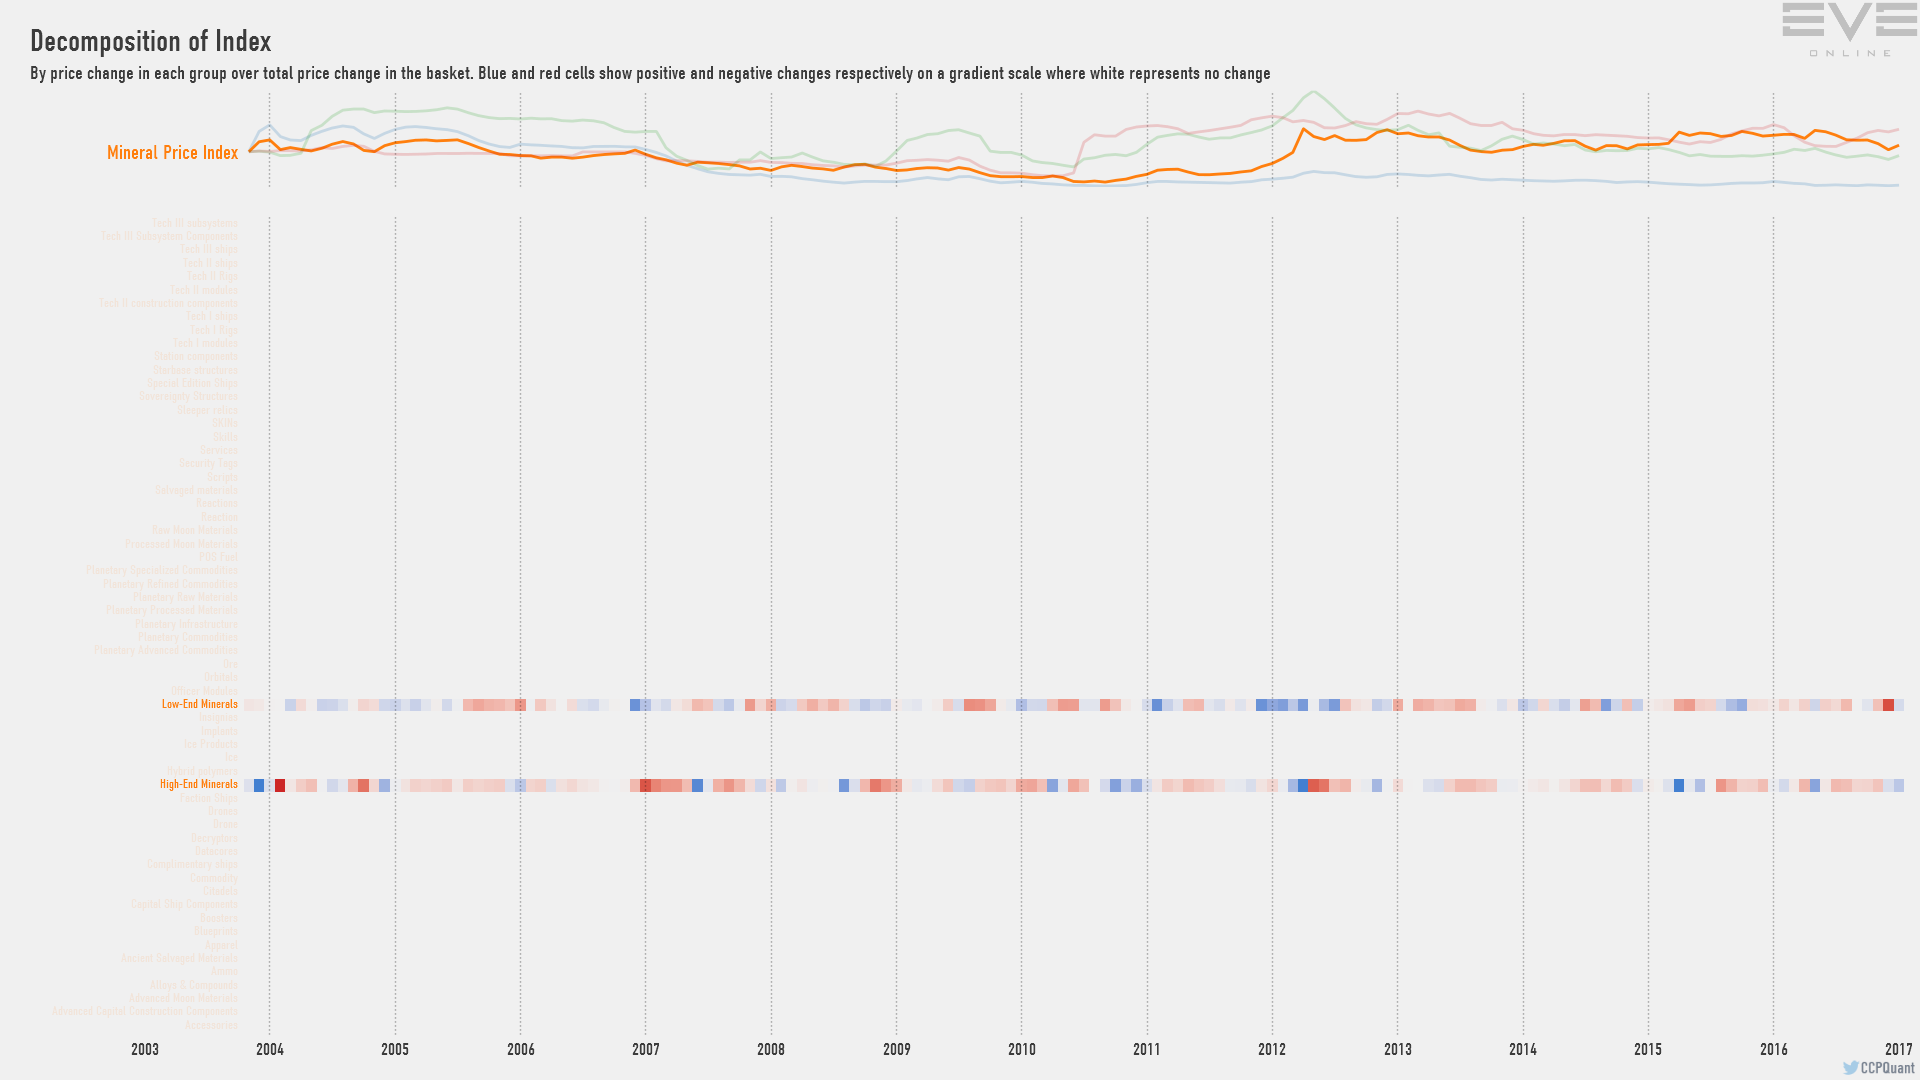
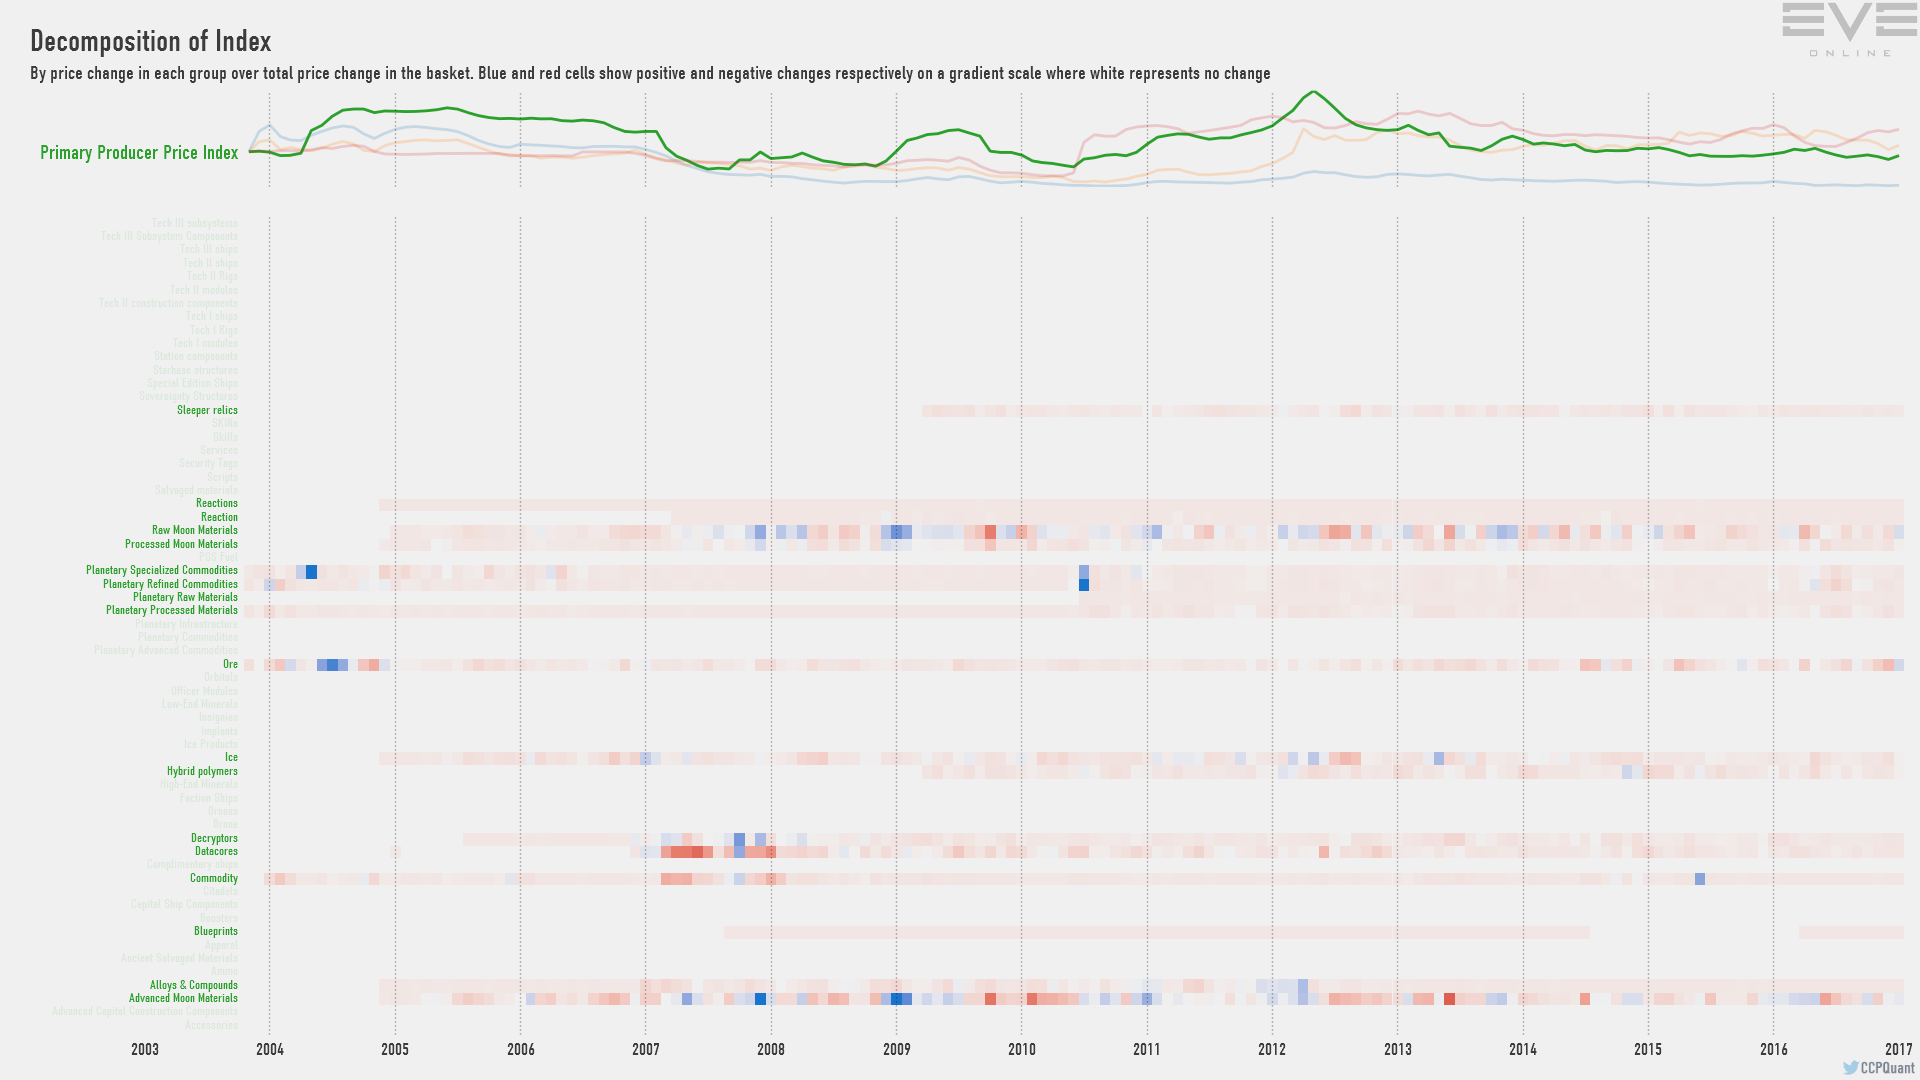
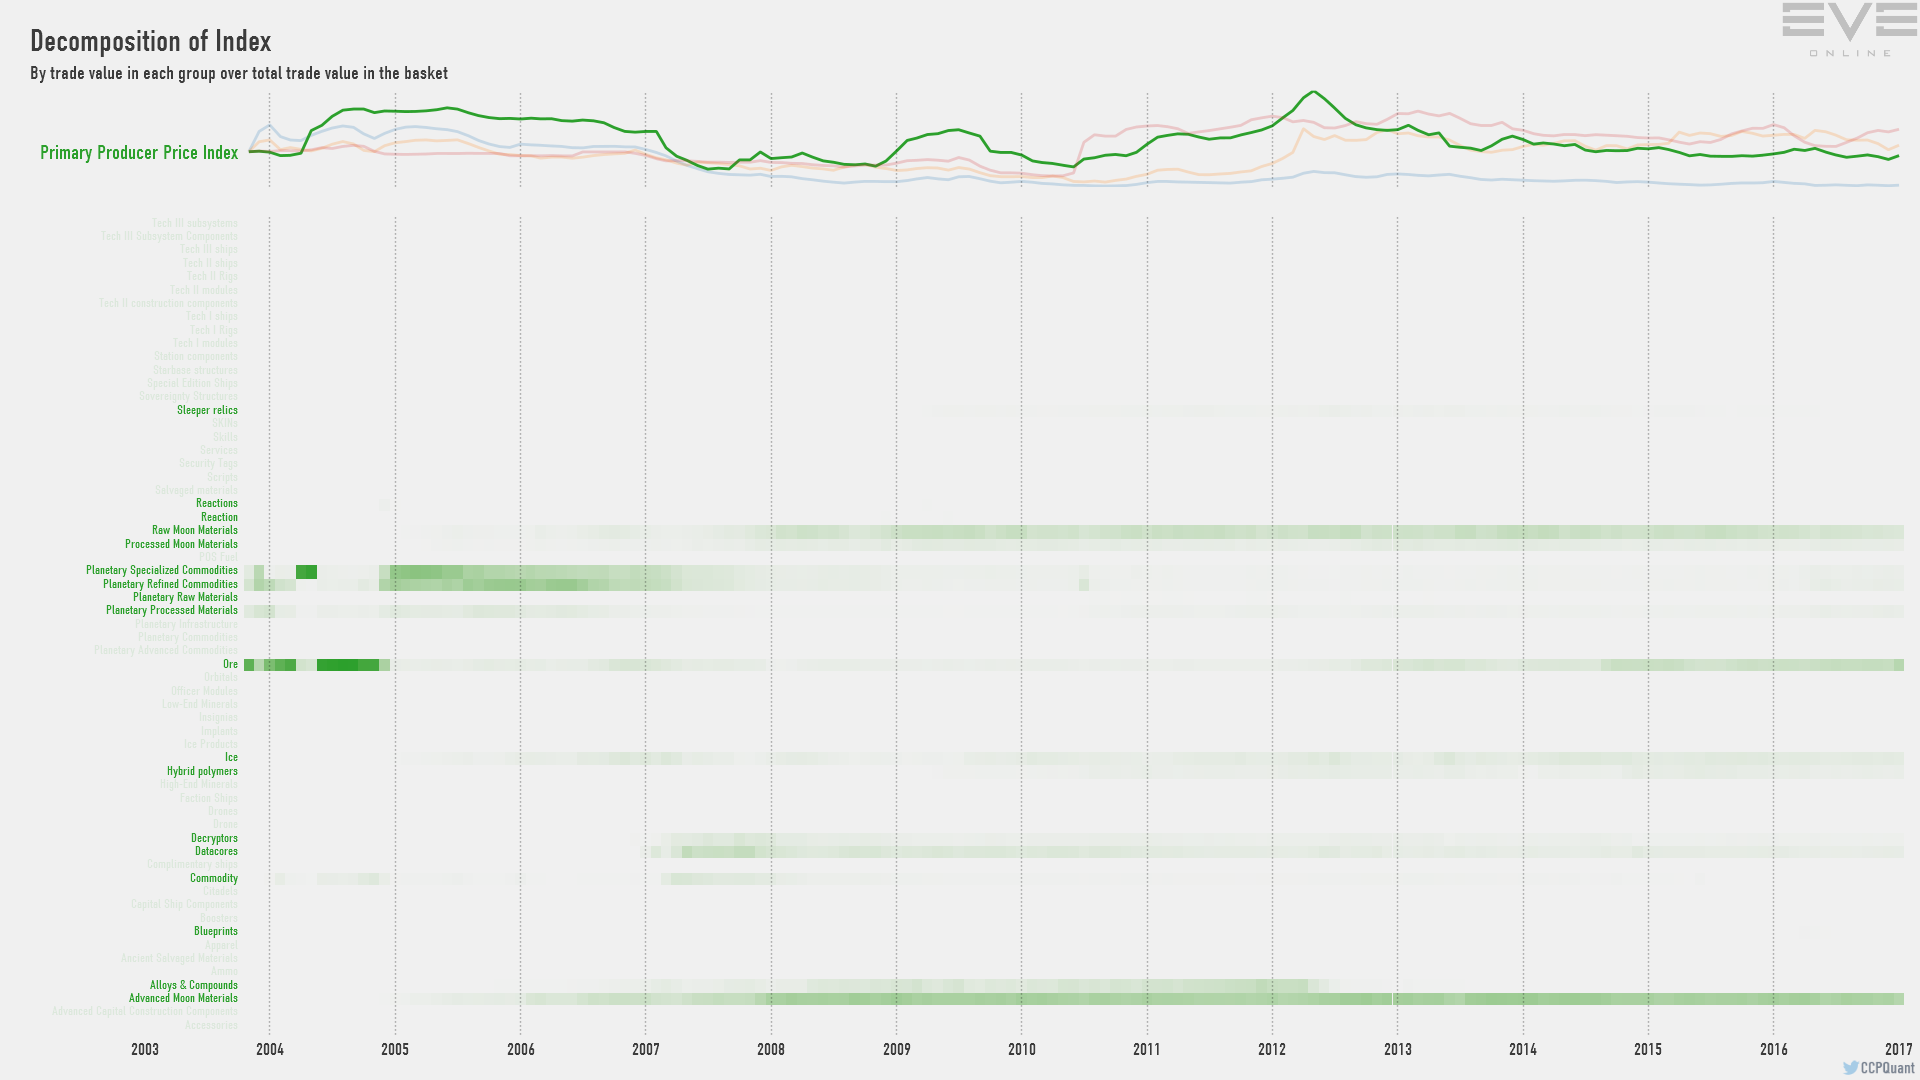
Please click the graphs to enlarge them as needed, also check out the graph slideshow.
The raw data and graphs that make up this report can be downloaded here (29 MB).
Please note that this MER is the last one containing regional stats, the next MERs will be more streamlined and not showing those graphs. This was a request by the CSM.
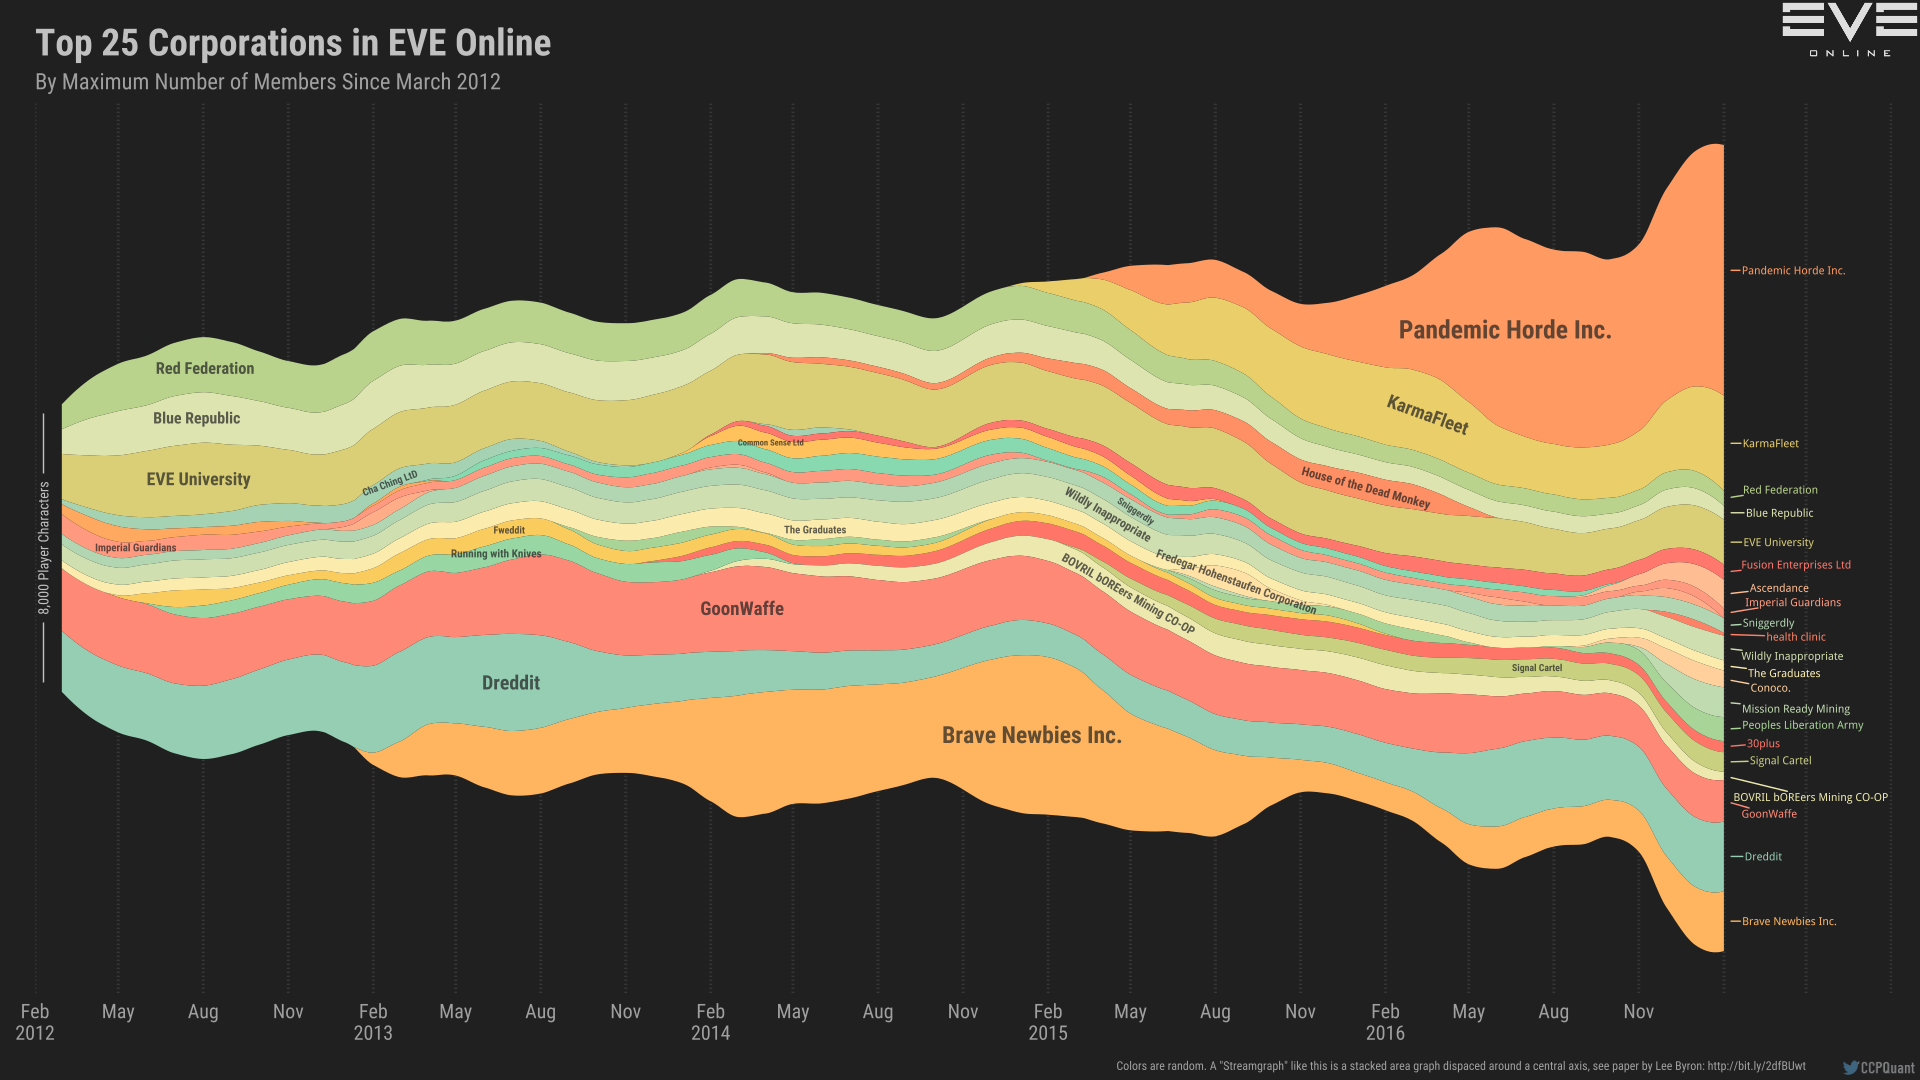
A bonus graph (develoment of the top 25 corporations since February 2012) can be found here.
Bonus graph!
Development of the top 25 corporations in EVE Online since 2012.

